The goal of a business is to generate profit, generate as much profit as it can, and to grow that bottom line consistently over time. After all, these profits — or the likelihood of bigger profits in the future — are the most important consideration for shareholders.
This raises the question, though: Why? It can’t be just scorekeeping. What’s the purpose of accumulating profits?
There are actually two conceivable purposes:
- Giving the money to investors and
- Everything else.
No. 2 is what we mean by retained earnings. But to give you a more precise definition, retained earnings is the cumulative profits a company has earned to date, minus dividends or any other distributions paid to investors.
Key takeaways
- Retained earnings is a company’s accumulated profits.
- Retained earnings is increased (or decreased) periodically by newly reported net income (or loss).
- Retained earnings is recorded on the balance sheet; it is a pool of money available for capital expenditure, R&D, M&A, retiring debt or any other internal function and is considered a part of shareholders’ equity rather than as an asset.
- Comparing retained earnings over the course of a period of years against appreciation in the share price over that same period illustrates how well the company’s management reinvests its net profit.
- Several factors determine whether it is more desirable for a growing business to increase its retained earnings or increase its dividend.
Retained Earnings Formula
The retained earnings equation is fairly straightforward:
Ending Retained Earnings = Beginning Retained Earnings + Current Period Profits – Dividends
Following convention, whenever we use the term “retained earnings” we mean “ending retained earnings” unless otherwise indicated. If the number you solve for turns out to be negative, it’s called “accumulated deficit”.
Although dividends are usually paid in cash, there is such thing as a stock dividend and the cost of that would also be subtracted out of net income to arrive at retained earnings.
There are a number of factors that determine how much a company should pay out to shareholders on a quarterly basis and how much they should retain. Generally speaking, the more innovative a company is, the more it needs to spend internally to keep its growth on track. The more mature a company is, the more it needs to earmark for dividends to attract value investors. Thus, we present the balance sheet of Merck, a major player in Pharmaceuticals — an industry that is at once innovative and mature:
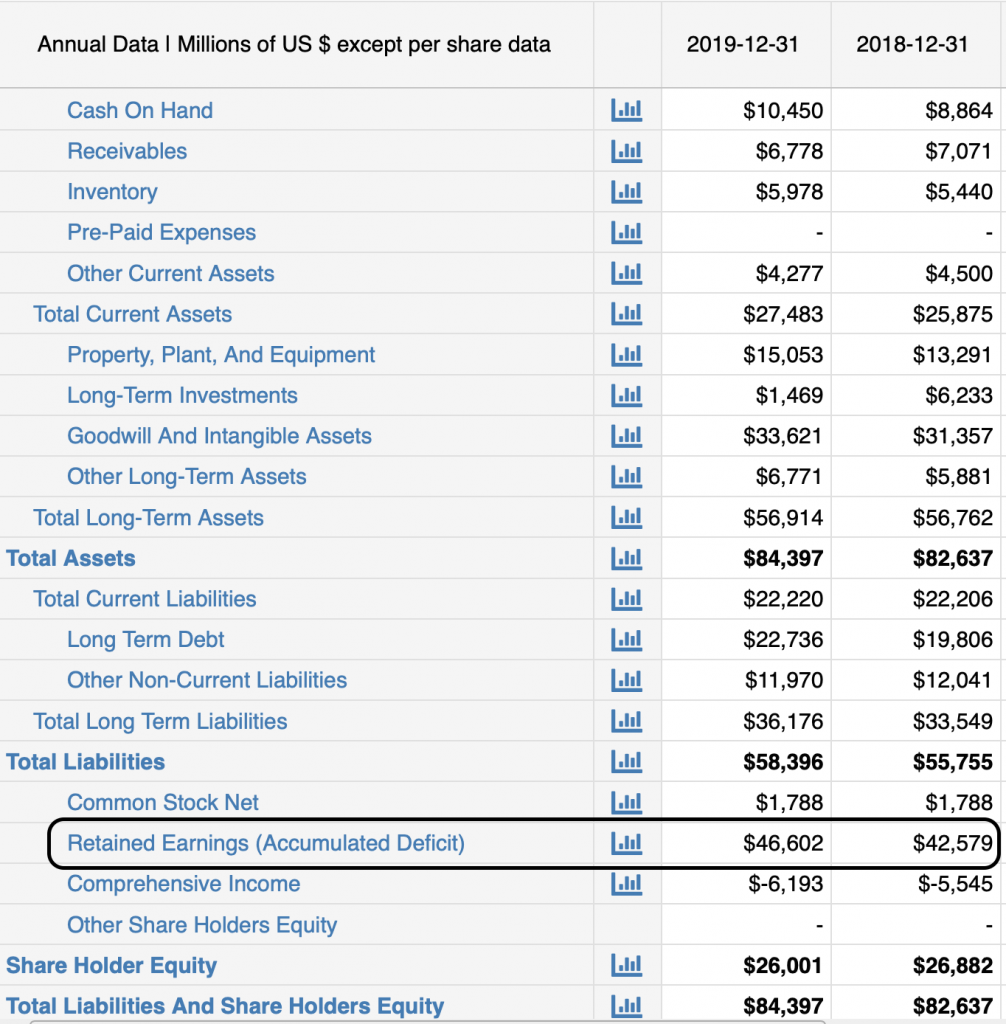
The first thing you’ll notice is that retained earnings — which is in essence net profit — is on the balance sheet rather than the income statement. That’s because it’s whenever a company makes a profit or takes a loss, that change accrues — and it keeps accruing year after year.
The next thing you’ll notice is that it’s a component of shareholders’ equity rather than an asset — which is counterintuitive considering it’s a big chunk of cash. While that’s true, it’s technically not the company’s cash; it belongs to the shareholders. Management only gets to use it by their permission.
Some of the things investors want to see management spend wisely on are:
- Working capital to cover current operations,
- Capital expenditures to expand operations,
- Acquisitions,
- Research and Development,
- Marketing,
- Funding reserves against expected future losses or
- Paying off debt.
This last item is important because it underscores the essential difference between a company’s two groups of investors: shareholders and bondholders. While retained earnings can be used to retire bonds, it by definition can’t be used to pay dividends.

But let’s be more granular about what goes into a company’s decision as to how much to return directly to investors and how much to use to reinvest in the business. According to AccountingTools.com, there are four determinants:
- Age of the company: An older company will have had more time in which to compile more retained earnings.
- Dividend policy: A company that routinely issues dividends will have fewer retained earnings.
- Profitability: A high profit percentage eventually yields a large amount of retained earnings, subject to the two preceding points.
- Cyclical industry: When a business is in an industry that is highly cyclical, management may need to build up large retained earnings reserves during the profitable part of the cycle in order to protect it during downturns.
Retained earnings in itself tells you very little about a company. If it’s a low number, does that mean the company isn’t profitable enough to have a rainy day fund? If it’s a high number, does that mean it’s hoarding money it should be returning to shareholders? And how do you even know if a retained earnings number is high or low?
It is all rather subjective, but let’s look at the history of Merck’s retained earnings and compare it to that of its competitors Johnson & Johnson and Pfizer.
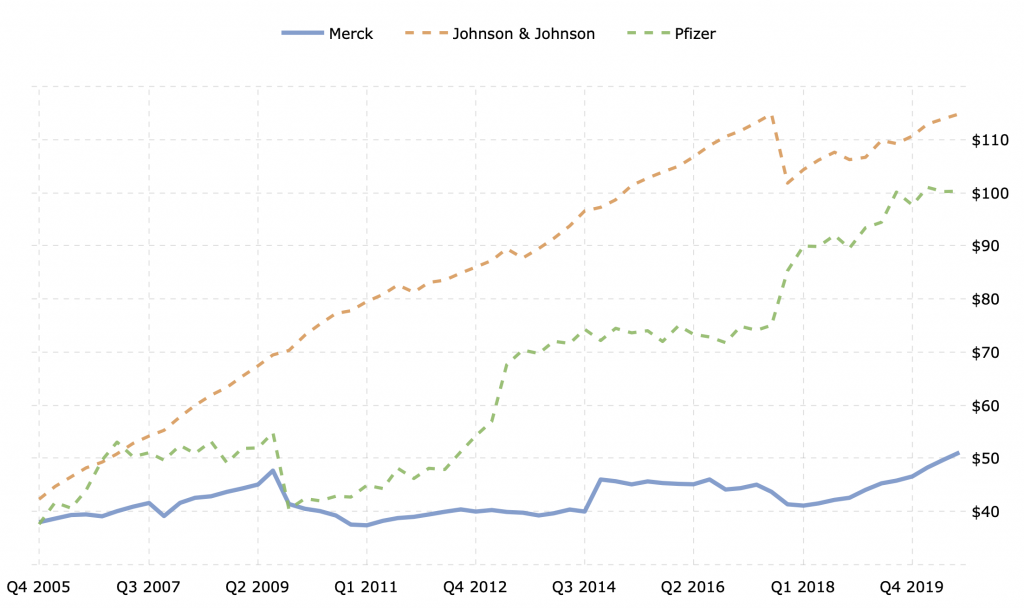
It would appear that Merck is lagging its two rivals but, as we just discussed, there are plenty of non-operating reasons why one company’s retained earnings would be lower than its competitors’. And as we’re about to explore, these numbers mean very little in the abstract. Context is everything and, once you apply it, you’ll see Merck’s standing switch places with that of one of its peers.
Retained earnings and valuation
There is one key ratio for which retained earnings is an input. Retained Earnings to Market Value measures how well a company’s management team turns a dollar of value into hopefully more than a dollar in share price, and it’s calculated in one of two ways:
Retained Earnings to Market Value =
Change in Market Cap in Period n / Total Net Income in Period n
or
Change in Share Price in Period n / Total EPS in Period n
where EPS is Earnings Per Share
We’ll be using the second equation, as most analysts do, but you would get the same result with the first.
What’s unusual about this metric is that it’s intended as a measurement of a company’s performance over the long term. Certainly, “Period n” could be one year or even one quarter, but that’s not particularly helpful. The truth which analysts are trying to arrive at is corporate management’s track record of deploying retained earnings to increase the value of each investor’s shares. That requires more than a snapshot view. So let’s assume a three-year time horizon for this calculation.
Because we’re considering a subset of a company’s retained earnings rather than the entire amount, we return to the Merck income statement to compute it:
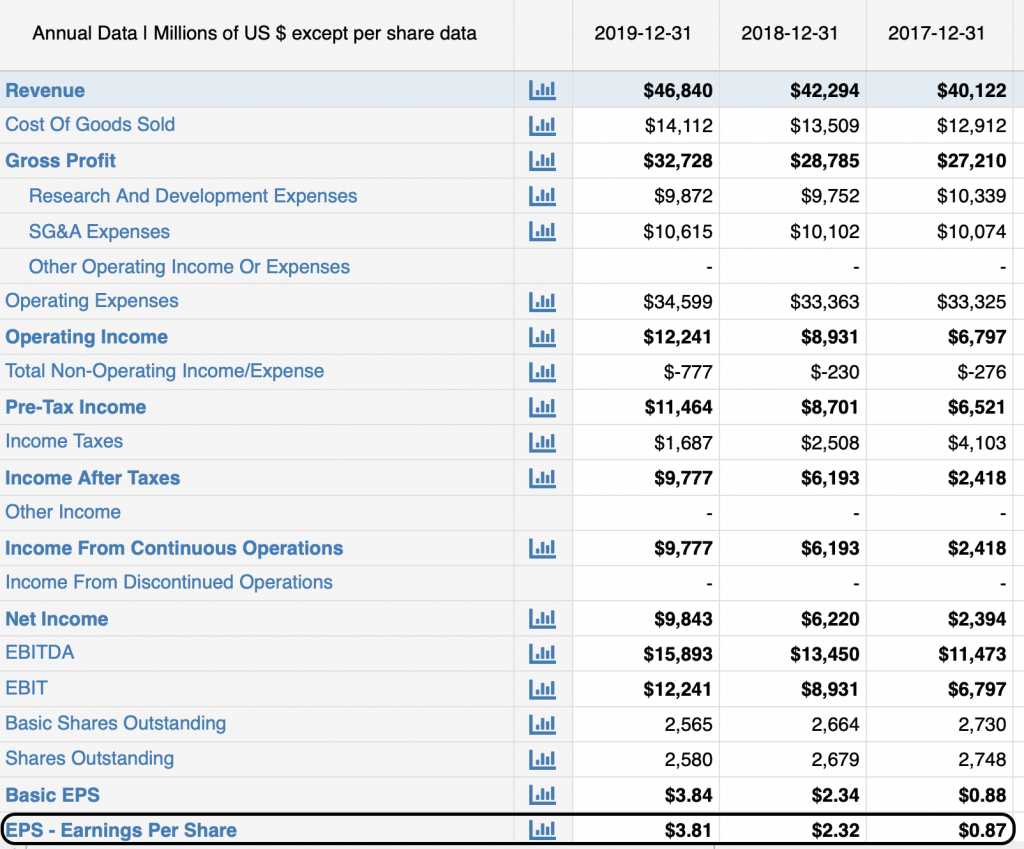
If we add up the EPS results, we get a round $7.00 in retained earnings per share over three years. The next step is to see how much the share price rose over the course of those three years.
As you can see from the column heads, Merck’s fiscal year is identical to the calendar year, ending on December 31. Of course, it takes a matter of weeks after the books are closed before they can be summarized, audited and reported. Merck’s full-year 2019 financials were reported February 5, 2020, so we’ll use the stock’s closing price for that date and the three-years-earlier date.
The stock’s market price doesn’t come from the income statement, but it’s easily culled from any of a number of financial news websites. These include CNBC, CNN Business and Yahoo! Finance, all of which are accessible without a paid subscription. Of these, Yahoo! Finance has the most intuitive path toward finding historical share price data, so let’s use that site to take a look at what Merck’s price was on the date 2019 full-year earnings were reported, and the price three years to the day earlier:
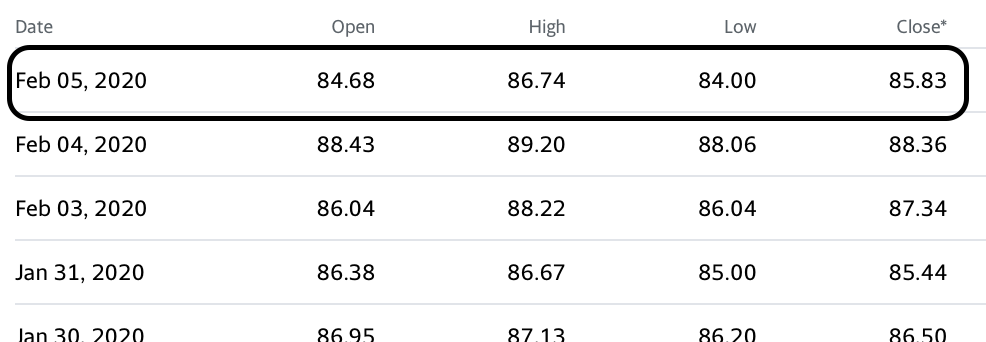
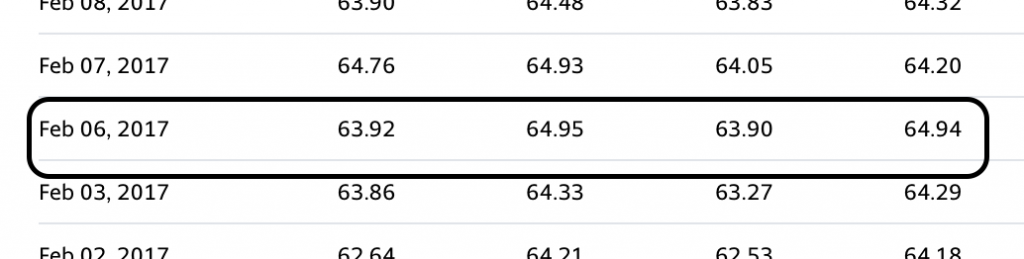
MRK closed at $85.83 the day the company announced its 2019 earnings, and at $64.94 three years prior. That’s a difference of $20.89, or a 32.2% gain. But let’s look at that $20.89 three-year share price appreciation through another lens: as a factor of Merck’s retained earnings through that same period. If we divide that gain $20.89 by $7.00 in accumulated retained earnings, we get a multiple of 2.98. That tells investors that, for every $1 Merck earned during that period and didn’t pay out in dividends, it raised the share price by $2.98. When you add the $2.44 dividend per share, it becomes quite a compelling story.
That’s particularly true because, given the choice between being paid a $1 dividend per share or having that share go up in price by $1, most investors would choose the latter for a multitude of tax reasons.
But let’s put dividends aside for a moment and see how Merck performed against its peers in terms of Retained Earnings to Marked Value:
| Company | 3-year RE/MV |
| Merck | 2.98 |
| Johnson & Johnson | 3.37 |
| Pfizer | 0.72 |
From this table, we can see that Merck and Johnson & Johnson had similar records by this metric, with J&J having the edge. No doubt, though, Pfizer executives were concerned with their own performance. For every dollar per share they held onto, the stock price went up only only 72 cents. From the investors’ perspective, they’d have been 28 cents per share richer if Pfizer had just paid them a special dividend instead of spending it on R&D or expanding operations.