While revenue might be one of the easiest financial terms to explain — it’s how much money a company made from sales — it is also one of the more nuanced.
It’s actually something of a misnomer. Revenue is the Middle French word for “returned,” as in a return on investment. As such, it should really mean net income, but there’s no use quibbling against 600 years of misinterpretation.
Key takeaways
- Revenue, also called net sales or turnover, is the value of all goods and services recognized by a company in a given period.
- Refunds and returns must be subtracted from gross sales to be considered revenue.
- Revenue can be in the form of either cash or accounts receivable.
- Gross profit margin, asset turnover and revenue per employee are key ratios for determining a company’s efficiency, while price per sales and enterprise value per sales measure how much investors are willing to pay for their share of the company’s revenue stream.
- Revenue ratios need to be kept in the context of other efficiency metrics more focused on bottom-line earnings.
The revenue formula
When you sell a single item, the price the buyer pays for it is your revenue. But let’s say you sell a hundred or a thousand of that item, then:
Sales = Sales Price x Quantity of Units Sold
Most if not all publicly traded companies, however, sell more than one item. The summation of all these streams is the company’s gross sales.
Let’s look at a typical income statement, and how the top line serves as the starting point for all further earnings calculations and ratios. And if we’re going to discuss revenue, then let’s focus on Walmart which, year in and year out, has the highest revenue of any U.S. corporation — almost twice that of Amazon, ExxonMobil or Apple, according to the Fortune 500 ranking:
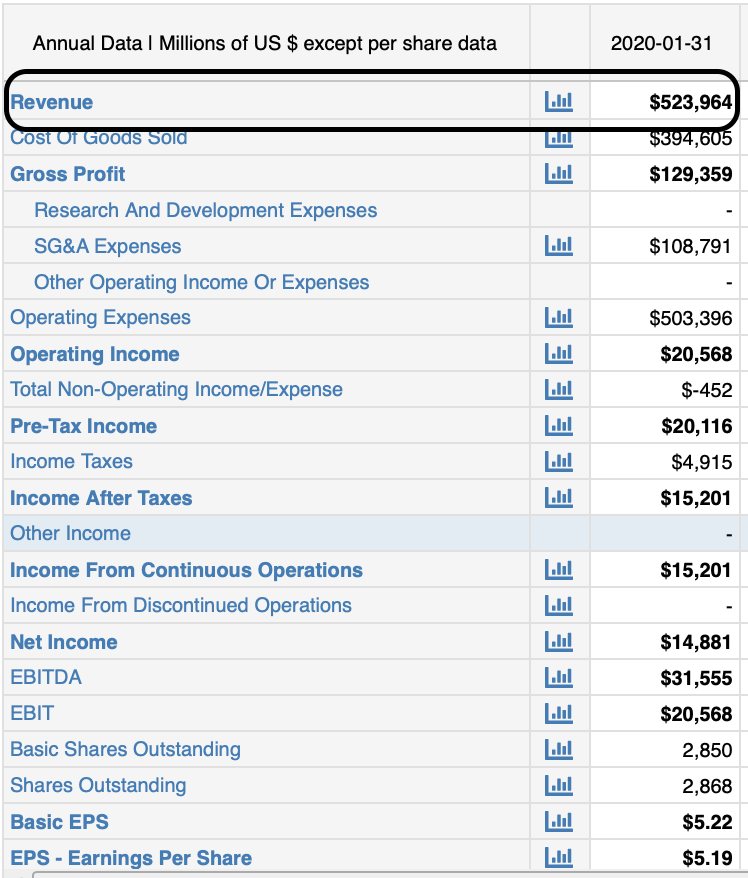
Remember that this $524 billion in revenue — that’s more than the GDP of 186 countries out of 211, edging out Argentina — doesn’t include allowances, discounts or returns. How much more merchandise is Walmart selling? A perusal of the annual report it filed with the Securities and Exchange Commission doesn’t say. In fact, you could look through the 10-Ks of just about any brick-and-mortar retailer and you won’t find them discussing it either. Gross sales reporting is not required by statute, regulation or Generally Accepted Accounting Principles (GAAP), and it’s apparently a sore subject. It’s difficult to even come by an industry average to determine what a “normal” ratio of gross-to-net sales would be. Apparently that number exists, though, because Walmart’s 10-K notes that, “Estimated sales returns are calculated based on expected returns,” a statement every bit as circular and opaque as it was intended to be.
Then comes the entire question of revenue recognition: When can a company claim that it has made a sale? Clearly, with the proportion of sales that are made on credit, companies can’t wait to be paid in full to declare that a transaction has occurred.
Revenue is recognized when the benefits and risks of ownership are transferred to the buyer from the vendor, or when the delivery of services is complete. Whether the asset the vendor receives in return is cash or an accounts receivable credit is immaterial.
Getting back to Walmart for a moment, let’s remember that it sells services as well as products. For example, membership in its Sam’s Club warehouse outlet unit offers no tangible product in and of itself. So when you buy a Sam’s Club membership, does Walmart report that revenue the day you get your membership card or the day it expires?
Neither, as it turns out. If you buy a 12-month membership, Walmart recognizes one-twelfth of that fee each month, even if you paid for the full year on Day 1.

What is considered a good revenue?
Because revenue is a raw number rather than a ratio, there’s no such thing as a “good” or “bad” figure. One thing to pay attention to, though, is how much gross profit a company reports as a proportion of revenue. This gross profit margin, is calculated as:
Gross Margin = (Revenue – COGS) / Revenue
where COGS is cost of goods sold
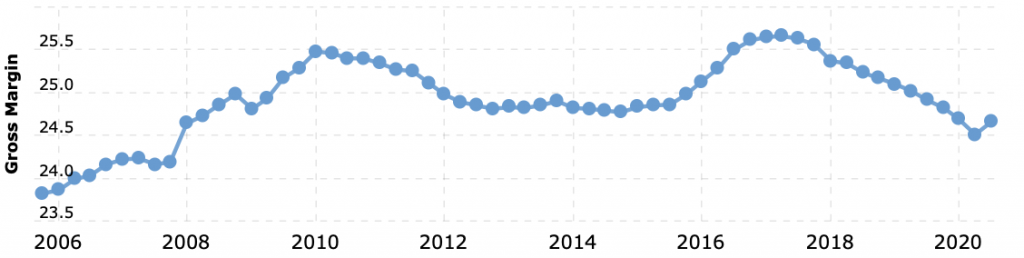
COGS is essentially the cost of inventory. When you subtract it from revenue, you get gross profit. Gross profit margin, then, is gross profit as a percentage of revenue. This is a high-level indicator of profitability and efficiency which explains how much money a company keeps directly from operations compared to how much it took in from sales. In the current case, Walmart’s 2019 gross profit of $129.4 billion is 24.7% of its $524.0 billion in revenue. That suggests that, out of every dollar Walmart took in that year, it spent around a quarter on inventory. That’s about par for the course for Walmart since 2008.
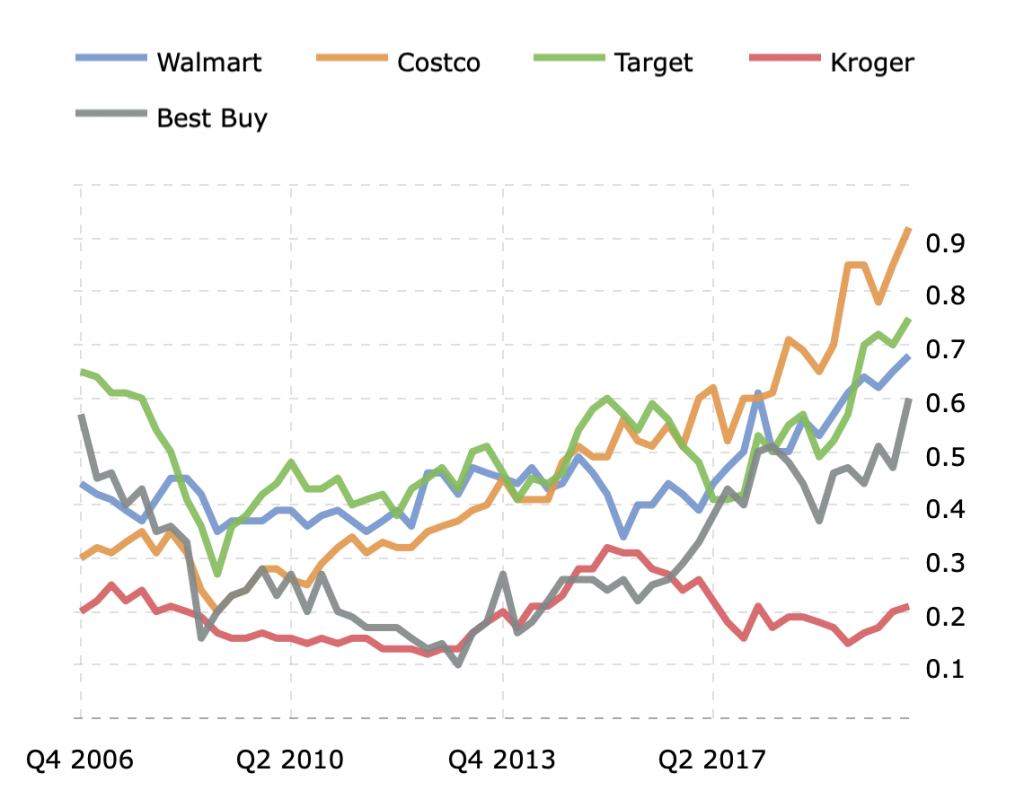
What might be instructive, though would be to compare Walmart with its peers Costco, Target, Kroger and Best Buy:
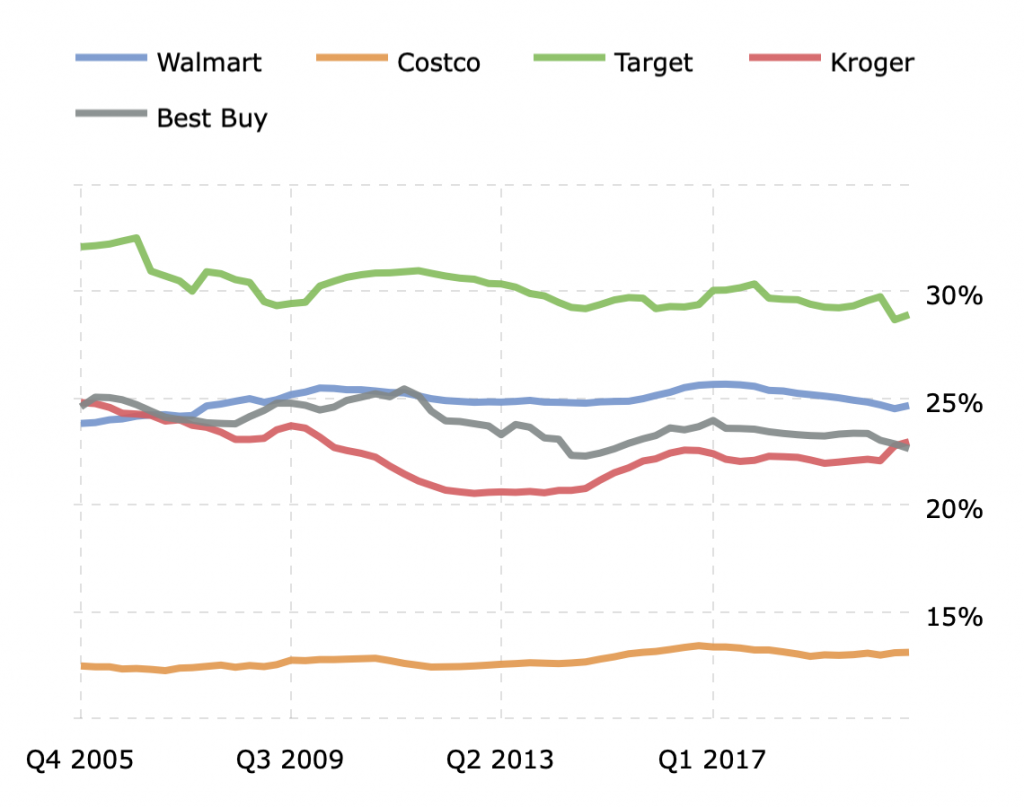
From this chart, we can see that Target is at the top of the industry in terms of gross margin and Costco trails it, while Walmart, Kroger and Best Buy are sandwiched in between.
According to CSIMarket, gross margins for the S&P 500 have generally been in the 40%-50% range, but retail has always had fairly tight margins compared with other industries.
Another often-cited revenue ratio is asset turnover, which measures how efficiently a company translates its assets into sales. It is calculated:
Asset Turnover = Revenue/Average Total Assets
where Average Total Assets is
(Starting Assets + Ending Assets) / 2
To save time and trouble, some analysts just use ending assets as the denominator rather than calculate the average, but we’ll go old-school here. To find total assets, we go to the balance sheet.
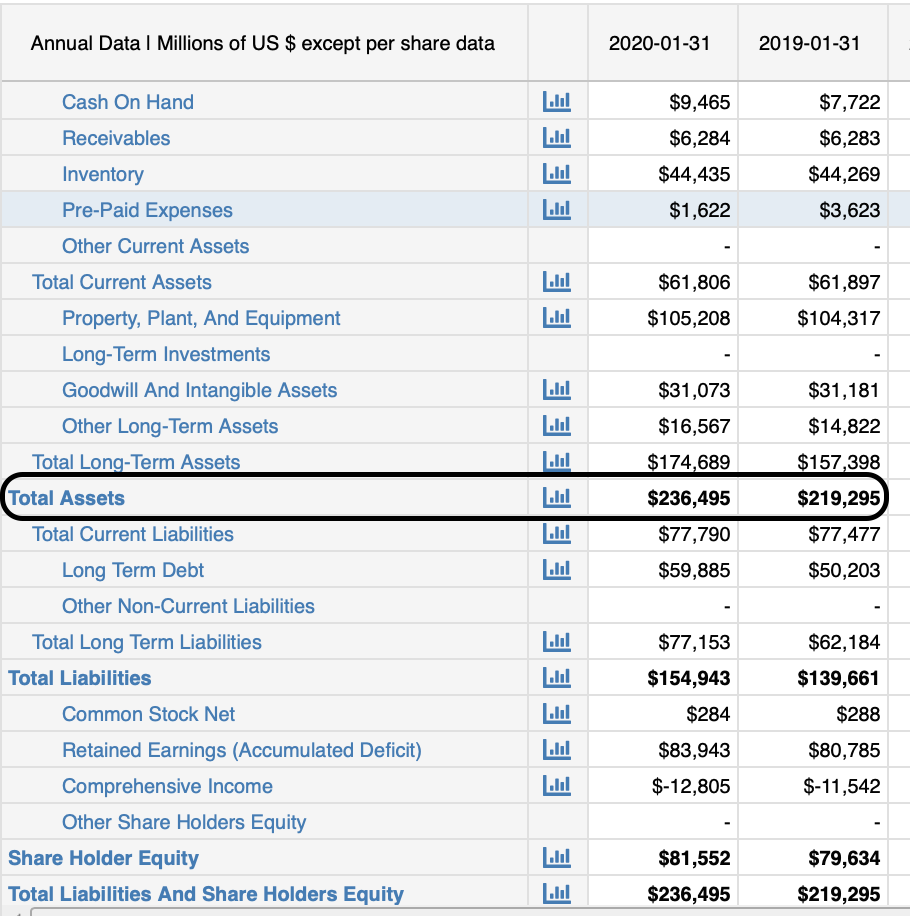
You can see why analysts sometimes don’t bother with averaging assets. In Walmart’s case, there’s only a handful of percentage points’ worth of difference between the total assets with which the company ended the most recent fiscal year and those with which it ended the previous one. When we find the mean by $236.495 billion and $219.295 billion, we get $227.895 billion. That’s not going to materially affect the results.
Regardless, when we divide revenues of $523.964 billion by that average, the result is 2.3. This is actually a pretty high number as the S&P 500’s aggregate is usually somewhere around 0.3, meaning that it takes more than three years of sales to pay for all the stuff the company owns. Walmart, on the other hand, has annual sales that more than double its total assets. Retailers in general tend to have asset turnovers just below 2.0, so Walmart does quite well by that metric.
If you think about it, though, this makes perfect sense because, as you can impute from the company’s balance sheet, its assets seem to be well-focused on sales. Inventory is essentially future sales, as is Prepaid Expenses, which is mainly gift cards that were bought but not yet used and portions of membership fees yet to be recognized. Cash and Accounts Receivable are, of course, nothing other than sales that have already occurred. While the largest bucket of assets is Property, Plant & Equipment, that’s mainly store properties. You’d expect all this in the Retail sector. There doesn’t appear to be a lot of intangible or extraneous assets like there might be in Information Technology, for example, where “vaporware” is frequently developed at a high cost, proves to be of no commercial value, then stays on the books for years.
By the way, some analysts take the further step of dividing asset turnover by 365 to arrive at asset turnover days.
Another fairly crude ratio that’s used as an indicator of efficiency is Revenue Per Employee. The higher the number, the more productive the average employee.
Finding the employee headcount is fairly easy, but you won’t find it in the financial statements. It’s not a secret, just not part of GAAP. You’ll usually find it in a company’s marketing or investor relations materials, and it will probably be mentioned at least in passing in the text of the company’s annual report. According to Walmart’s 10-K, it had 2.2 million employees at the end of fiscal year 2019 generating $524.0 billion in revenue. That means Walmart had net sales of $238,265 per employee. While this sounds like a lot, the S&P 500 average is almost double that. Still, one expects that such labor-intensive industries as Retail or Food & Beverage would have lower Revenue per Employee figures than more automated endeavors. Even so, Walmart is not the industry leader by this measure.
Revenue and Valuation
Revenue is of interest to the investor community because it informs a key valuation metric, the Price-to-Sales ratio, or P/S, which is computed in either of two ways:
P/S =
Market Capitalization / Revenue =
Share Price / Revenue Per Share
Revenue is already known from the top line of the income statement, but the market cap won’t be found there. It can, however, be easily culled from any of a number of financial news websites. These include CNBC, CNN Business and Yahoo! Finance, all of which are accessible without a paid subscription.
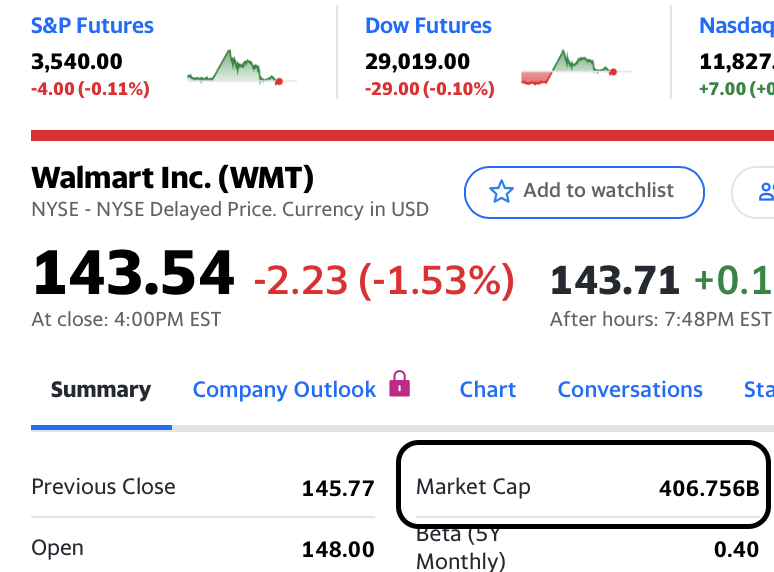
By dividing a market cap of $406.8 billion by revenue of $524 billion, we arrive at a P/S of 0.79. You would arrive at the same number had you calculated revenue per share by dividing revenue of $524 billion by 2.9 billion shares outstanding to get revenue per share, then dividing the share price of $143.54 by that result.
A P/S of 0.79 is nothing to brag about in general, but not all that bad for a retailer. This indicates that investors are willing to pay 0.79 times what Walmart sells in a year to own it. This sector’s aggregate P/S usually hovers around 1.00 and is often the lowest of any segment of the S&P 500.
With that known, the next step is to compare it with its peers:
While investors seem to be discounting Kroger on this basis and mildly favoring Costco, Walmart is firmly in the middle of the pack.
Sometimes a heavily cyclical sector such as Energy will have a lower aggregate P/S than retail during a recession, but then it will swing back toward the top once the economy expands again. Information Technology firms generally have the highest P/S, often exceeding 7.0.
Other considerations
We discussed gross sales at the beginning of this article, but that’s usually not even included on the income statement; sales often enough aren’t final, and sometimes there are other issues. AccountingTools.com describes three items that need to be subtracted out before arriving at a number meaningful to investors:
- Allowances: These occur when a product is marked down due to a minor defect.
- Discounts: As an incentive for early payment, many vendors offer a discount to customers who pay ahead of schedule — typically 2% for payment in full within 10 days of invoicing.
- Returns: Of course, we’ve all received gifts we didn’t want or were otherwise unsatisfied with the product we received. The refund granted to us upon return has to backed out of gross sales.
After subtracting all that out, we get to net sales, which is the true “top line”. It is net sales that is meant by “revenue” or, in many countries, “turnover”.
Aside from that, GAAP allows for some latitude in how companies define “net sales”. In its financial statements, Walmart incongruously uses the term “Gross Sales” to indicate “Net Sales”. With that as the top line, it deducts currency translation effects — which are generally reserved for the Total Non-Operating Income/Expense — to arrive at what it calls “Net Sales”. Macrotrends normalizes such accounting quirks for you.
Limits of revenue ratios
The difference has nothing to do with the perceived “sexiness” of tech and everything to do with revenue growth. While brick-and-mortar retail is in secular decline, tech is by definition always on the cusp of finding new revenue channels. Whether we’re talking about new social media platforms or new ways for large enterprises to anticipate the needs of its clientele, there’s always money to be made in tech.
But regardless of its velocity, a company’s revenue is always a moving target and a static P/S isn’t always as informative as analysts would like. Any forward-looking — and thus useful — indicator would have to account for growth. The trouble is, how do you forecast it? It requires a lot of assumptions but, if you can calculate a sustainable growth rate for the company, you can enter that into a more complex formula yielding a “justified” P/S.
Another shortcoming of P/S is that it focuses entirely on the equity side of the capital stack. Bond holders are investors too. That’s why many analysts also look at a company’s Enterprise Value-to-Sales ratio which is more capital structure-neutral:
EV/S = Enterprise Value / Net Sales
Where Enterprise Value is the sum of market capitalization, debt, minority interests, preferred equity and unfunded pension obligations, less the value of associated companies, less cash and cash equivalents
EV/S might not be as germane for analysis Walmart, with its fairly low debt burden, as it would be for analysis of hardware megastore Lowe’s Companies, telecom AT&T or other corporations that grow by acquisition then float bonds to pay for them.
Getting back to asset turnover, it’s not considered a particularly useful metric in the abstract. Still, it’s an input into a number of more sophisticated fundamental analysis models including that for justified P/S.
It is also a metric that, to be instructive, must be parsed into two distinct views: fixed asset turnover and working capital turnover. The former measures how well fixed assets are used to generate sales, while the latter measures how current assets minus liabilities to generate sales. To present them formulaically:
Fixed Asset Turnover = Revenue / Total Long-Term Assets
and
Working Capital Turnover = Revenue / Current Assets – Current Liabilities
Long-term assets, current assets and current liabilities can all be found on a company’s balance sheet.
Ultimately, though, the greatest shortfall of any ratios based on revenues is that it tells nothing about the company’s profitability. After all, the most important thing is how much the company keeps, not how much it sells.
That said, revenue is critically important in that it’s considered a leading indicator of how well a company is likely to grow its earnings going forward. If revenue is increasing but net income remains stuck, investors might still view the stock favorably, reckoning that the bottom line’s growth will eventually catch up with the top line’s. Conversely, if a company’s revenues have slowed or reversed and yet net income continues to grow, investors will be leery of the quality of those earnings. Investors might assume that the company is more successful at cutting costs than finding new customers, and that’s no way to expand a business. So revenue metrics are important to view, but only in a broader context.