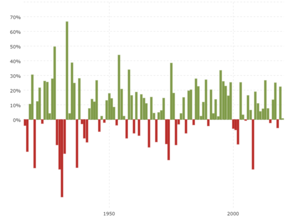
NASDAQ Composite - 45 Year Historical Chart
Interactive chart of the NASDAQ Composite stock market index since 1971. Historical data is inflation-adjusted using the headline CPI and each data point represents the month-end closing value. The current month is updated on an hourly basis with today's latest value. The current price of the NASDAQ Composite Index as of February 13, 2025 is 19,945.64.
| NASDAQ Composite - Historical Annual Data | ||||||
|---|---|---|---|---|---|---|
| Year | Average Closing Price |
Year Open | Year High | Year Low | Year Close | Annual % Change |
| 2025 | 19,596.84 | 19,280.79 | 20,053.68 | 19,044.39 | 19,945.64 | 3.29% |
| 2024 | 17,247.45 | 14,765.94 | 20,173.89 | 14,510.30 | 19,310.79 | 28.64% |
| 2023 | 12,784.29 | 10,386.98 | 15,099.18 | 10,305.24 | 15,011.35 | 43.42% |
| 2022 | 12,224.35 | 15,832.80 | 15,832.80 | 10,213.29 | 10,466.48 | -33.10% |
| 2021 | 14,371.46 | 12,698.45 | 16,057.44 | 12,609.16 | 15,644.97 | 21.39% |
| 2020 | 10,201.51 | 9,092.19 | 12,899.42 | 6,860.67 | 12,888.28 | 43.64% |
| 2019 | 7,940.36 | 6,665.94 | 9,022.39 | 6,463.50 | 8,972.61 | 35.23% |
| 2018 | 7,425.96 | 7,006.90 | 8,109.69 | 6,192.92 | 6,635.28 | -3.88% |
| 2017 | 6,235.30 | 5,429.08 | 6,994.76 | 5,429.08 | 6,903.39 | 28.24% |
| 2016 | 4,987.79 | 4,903.09 | 5,487.44 | 4,266.84 | 5,383.12 | 7.50% |
| 2015 | 4,945.55 | 4,726.81 | 5,218.86 | 4,506.49 | 5,007.41 | 5.73% |
| 2014 | 4,375.10 | 4,143.07 | 4,806.91 | 3,996.96 | 4,736.05 | 13.40% |
| 2013 | 3,541.29 | 3,112.26 | 4,176.59 | 3,091.81 | 4,176.59 | 38.32% |
| 2012 | 2,965.74 | 2,648.72 | 3,183.95 | 2,648.36 | 3,019.51 | 15.91% |
| 2011 | 2,677.44 | 2,691.52 | 2,873.54 | 2,335.83 | 2,605.15 | -1.80% |
| 2010 | 2,349.89 | 2,308.42 | 2,671.48 | 2,091.79 | 2,652.87 | 16.91% |
| 2009 | 1,845.39 | 1,632.21 | 2,291.28 | 1,268.64 | 2,269.15 | 43.89% |
| 2008 | 2,161.68 | 2,609.63 | 2,609.63 | 1,316.12 | 1,577.03 | -40.54% |
| 2007 | 2,578.47 | 2,423.16 | 2,859.12 | 2,340.68 | 2,652.28 | 9.81% |
| 2006 | 2,263.41 | 2,243.74 | 2,465.98 | 2,020.39 | 2,415.29 | 9.52% |
| 2005 | 2,099.32 | 2,152.15 | 2,273.37 | 1,904.18 | 2,205.32 | 1.37% |
| 2004 | 1,986.53 | 2,006.68 | 2,178.34 | 1,752.49 | 2,175.44 | 8.59% |
| 2003 | 1,647.17 | 1,384.85 | 2,009.88 | 1,271.47 | 2,003.37 | 50.01% |
| 2002 | 1,539.73 | 1,979.25 | 2,059.38 | 1,114.11 | 1,335.51 | -31.53% |
| 2001 | 2,029.61 | 2,291.86 | 2,859.15 | 1,423.19 | 1,950.40 | -21.05% |
| 2000 | 3,783.67 | 4,131.15 | 5,048.62 | 2,332.78 | 2,470.52 | -39.29% |
| 1999 | 2,728.15 | 2,208.05 | 4,069.31 | 2,208.05 | 4,069.31 | 85.59% |
| 1998 | 1,794.91 | 1,581.53 | 2,192.69 | 1,419.12 | 2,192.69 | 39.63% |
| 1997 | 1,469.48 | 1,280.70 | 1,745.85 | 1,201.00 | 1,570.35 | 21.64% |
| 1996 | 1,164.95 | 1,058.65 | 1,316.27 | 988.57 | 1,291.03 | 22.71% |
| 1995 | 925.19 | 743.58 | 1,069.79 | 743.58 | 1,052.13 | 39.92% |
| 1994 | 751.65 | 770.76 | 803.93 | 693.79 | 751.96 | -3.20% |
| 1993 | 715.16 | 671.80 | 787.42 | 645.87 | 776.80 | 14.75% |
| 1992 | 599.26 | 586.45 | 676.95 | 547.84 | 676.95 | 15.45% |
| 1991 | 491.69 | 372.20 | 586.34 | 355.80 | 586.34 | 56.86% |
| 1990 | 409.18 | 459.30 | 469.60 | 325.40 | 373.80 | -17.81% |
| 1989 | 437.81 | 378.60 | 485.70 | 378.60 | 454.80 | 19.24% |
| 1988 | 374.44 | 338.50 | 396.10 | 332.00 | 381.40 | 15.40% |
| 1987 | 402.58 | 353.20 | 455.80 | 291.90 | 330.50 | -5.25% |
| 1986 | 366.97 | 325.00 | 411.20 | 323.00 | 348.80 | 7.36% |
| 1985 | 290.23 | 245.90 | 325.20 | 245.90 | 324.90 | 31.49% |
| 1984 | 248.98 | 277.63 | 287.90 | 225.30 | 247.10 | -11.31% |
| 1983 | 285.43 | 230.59 | 328.91 | 230.59 | 278.60 | 19.87% |
| 1982 | 188.97 | 195.53 | 240.70 | 159.14 | 232.41 | 18.67% |
| 1981 | 203.18 | 203.55 | 223.47 | 175.03 | 195.84 | -3.21% |
| 1980 | 168.61 | 148.17 | 208.15 | 124.09 | 202.34 | 33.88% |
| 1979 | 136.57 | 117.84 | 152.29 | 117.84 | 151.14 | 28.11% |
| 1978 | 117.53 | 104.00 | 139.25 | 99.09 | 117.98 | 12.31% |
| 1977 | 98.71 | 97.69 | 105.05 | 93.66 | 105.05 | 7.33% |
| 1976 | 89.90 | 78.06 | 97.88 | 78.06 | 97.88 | 26.10% |
| 1975 | 77.20 | 60.70 | 88.00 | 60.70 | 77.62 | 29.76% |
| 1974 | 76.28 | 92.53 | 96.53 | 54.87 | 59.82 | -35.11% |
| 1973 | 109.96 | 134.63 | 136.84 | 88.67 | 92.19 | -31.06% |
| 1972 | 128.53 | 113.65 | 135.15 | 113.65 | 133.73 | 17.18% |


