What is the Current Ratio?
The current ratio is a measurement which assesses a firm’s ability to pay off its current liabilities. Current liabilities refer to short-term obligations due within one year. This ratio is a good way to measure how liquid a company is, how financially sound a company is in the short-term, and how many short-term assets a company holds vs. short-term liabilities.
The current ratio is calculated by taking the dollar value of a firm’s current assets and dividing it by the firm’s current liabilities. The current ratio is often compared to the quick ratio (or acid test) and the cash ratio, which include different assets and liabilities.
Key Takeaways
- The current ratio is a simple way to measure a company’s ability to pay off its short-term obligations without making additional sales or taking on additional debt.
- The current ratio is considered to be the least conservative of the liquidity ratios. The quick ratio is considered more conservative since it does not include a firm’s unsold inventory. The cash ratio is considered even more conservative yet since it excludes all other current assets besides cash.
- Generally, a higher current ratio indicates a healthier financial position. However, it can be misleading if future receivables outweigh current assets. This can occur if a client defaults or if debts mature faster than receipts.
Current Ratio Formula
The current ratio can be calculated using the following formula:
Current Ratio = Current Assets / Current Liabilities
It is important to note that many of these terms have precise financial definitions. These definitions may be slightly different than their common sense usage.
- Current Liabilities are obligations which mature within 12 months. current liabilities include such items on a company’s balance sheet:
- Short-term Debt
- Dividends Payable
- Notes Payable
- Current Portion of Deferred Revenue
- Current Maturities of Long-term Debt
- Interest Payable on Outstanding Debts
- Income Taxes Payable
- Current Assets are assets which are usually sold within that same 12 month period. Current assets include such items on a company’s balance sheet:
- Cash
- Cash Equivalents
- Inventory
- Accounts Receivable
- Marketable Securities
- Prepaid Expenses
- Other Liquid Assets
How to Calculate the Current Ratio from a Balance Sheet
Suppose we wanted to calculate the current ratio for Apple (AAPL). This is Apple’s consolidated balance sheet from September 28, 2019.[1] (All data is in millions.)
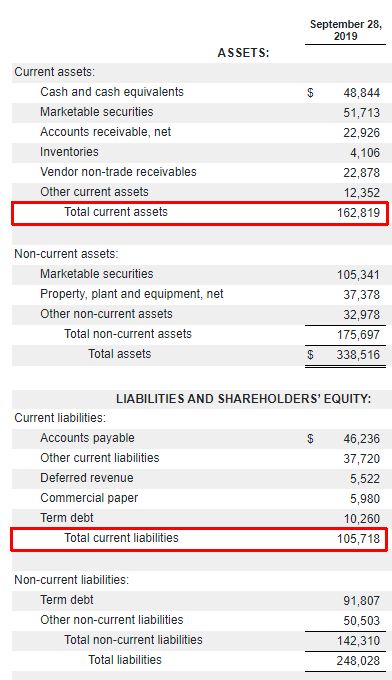
We calculate the current ratio by taking the “Total Current Assets” line item and dividing it by the “Total Current Liabilities” line item. For Apple, the current ratio can be computed as follows:
Apple Current Ratio = $162.819B / $105.718B = 1.54
This value tells us that as of September 28, 2019, Apple had current assets worth about 54% more than its current liabilities, or $1.54 of current assets for every $1.00 of current liabilities. This shows that Apple was in a healthy liquidity position at the time of this balance sheet.
What is a good Current Ratio?
Ideally companies want a current ratio of over 1.50, preferably as high as 2.0 to provide a significant liquidity cushion. Apple’s current ratio of 1.54 is quite solid and shows that there are more than enough current assets to cover current liabilities. If the ratio was down near 1.0, it would indicate that the company may have issues meeting short-term obligations, and that they may have issues paying off these obligations in the near future.
Smart investors understand that there is considerable variation between industries and their business and financial practices. Depending on the industry, companies will have different levels of inventory and sales, different company sizes, different turnover rates, different capital expenditures and requirements, and different levels of debt.
In 2019, the average current ratio across all industries was 1.55.[2]
- In FY19, the Top 5 sectors with the highest current ratios were Insurance Carriers (9.86), Agriculture production livestock and animal specialties (6.19), Fishing, hunting, and trapping (3.57), Chemicals And Allied Products (3.47), and Security And Commodity Brokers, Dealers, Exchanges, and Services (3.07).
- In FY19 the Top 5 sectors with the lowest current ratios were Motion Pictures (.33), Metal Mining (.46), Eating and Drinking Places (.58), Holding and Other Investment Offices (.75), and Personal Services (.75).
All of the following reasons might lead to some issues when interpreting the current ratio:
- Overestimation of Liquidity. Unlike the quick ratio, the current ratio includes inventory in the calculation, which can lead to overestimating how liquid the company is. For example, companies with higher inventory due to fewer sales or little to no demand for a product could show misleading liquidity and misrepresent the economic health of the company.
- Risky Receivables. Both the current ratio and quick ratio only account for receivables at face value, without considering what kind of receivables they are and without discounting for the risk of defaults.
- Seasonality. There could be major fluctuations between high and low current ratios for certain companies or sectors that have sales dependent on timing or seasonal factors.
- Inventory Valuation and Manipulation. Whereas the quick ratio does not account for inventory, the current ratio includes inventory in its calculations. Depending on how a company values and accounts for its inventory, it can truly manipulate and skew the current ratio.
Comparing Current Ratios of Apple (AAPL) and Walmart (WMT)
One thing to keep in mind when comparing current ratios, is that companies across different sectors will have different standards and practices. To see this in practice, consider the current ratios of Apple (AAPL) and Walmart (WMT). Walmart is an extremely inventory-heavy business with highly liquid stock. In other words, Walmart can sell large portions of its inventory in the near term, for close to book value.
Looking at the chart below, it is clear that the current ratio formula penalizes such companies. Despite its financial health, and successful business model, because Walmart’s inventory is so liquid compared to a company such as Apple’s, their current ratio which is around the .75-80 range, is almost half that of Apple’s. The current ratio can be very misleading in instances such as this when trying to compare two highly successful companies.
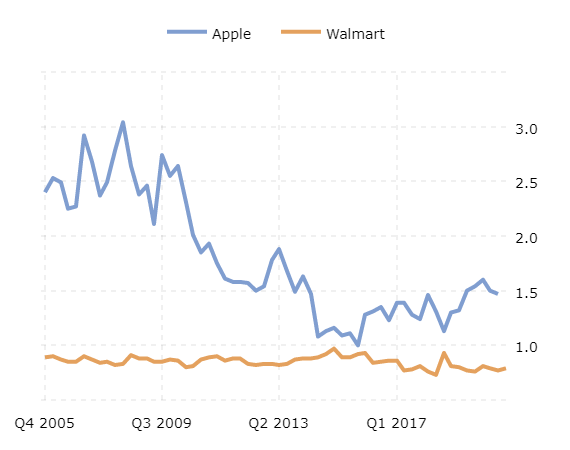
Source: Macrotrends
In addition, a company such as Apple that has been extremely successful and building up its cash positions and current assets will have a solid and strong current ratio throughout the years. Of course, with its stock price performance, Apple has built an extremely strong liquidity moat around it.
It is important to note that the current ratio is only one measure of a company’s financial health. Things such as opening a new plant or ordering a large batch of materials, which indicates strong expected demand, are going to register as liabilities first. Furthermore, long term investments such as buying land, or investing significant resources into property, plant and equipment, which are other signs of business expansion and growth, will not be considered in the current ratio either.
Current Ratio vs. Quick Ratio
The current ratio is not the only measure of a firm’s liquidity. Another key indicator is the quick ratio, which excludes inventory from its calculation.
The quick ratio is calculated as:
Quick Ratio = (Cash and Cash Equivalents + Marketable Securities + Accounts Receivable) / Current Liabilities
Or
Quick Ratio = (Current Assets – Inventory – Prepaid Expenses) / Current Liabilities
The quick ratio, by excluding inventory, paints a more conservative and realistic picture of a company’s liquidity position. The current ratio assumes that inventory is always converted into cash at full value. This is an unlikely scenario as a full-on fire sale of a company’s inventory would almost surely result in significantly lower prices.
Inventory is also extremely difficult to measure, especially for larger firms. Large companies may have inventory lying in warehouses across the globe or may deal with human error when counting. Inventory calculation could be greater or less than it really is, and as previously stated, could be manipulated to overinflate the current ratio. The quick ratio, by excluding inventory, has less of a risk of error or manipulation because of this.
Current Ratio vs. Cash Ratio
The current ratio is even more inflated than the cash ratio, which not only excludes inventory, but also excludes accounts receivables from its calculation.
The formula for the cash ratio is as follows:
Cash Ratio = Cash and Cash Equivalents / Current Liabilities
The cash ratio for Visa, for example, is only 0.584. This means that if Visa’s debts were due tomorrow instead of the 90 days assumed by both the current and the quick ratios, the company would be insolvent.
This example further expands on the point of how misleading the current ratio can be, and how it is by far the least prudent and least conservative measure of a company’s liquidity. While accounting for inventory can cause numbers to be overinflated or misleading, accounting for accounts receivable, without doing a deeper dive into what kind of receivables they are, completely ignores the risk of defaults.
Receivables, no matter what form, are an inherently risky asset. These are future payments that customers owe, for goods which they have already received. If customers do not pay their bills, or if there is some other kind of default, recovering debts can be a costly, drawn-out process.
Current Ratio vs. Quick Ratio vs. Cash Ratio
| Metric | Pros | Cons |
| Current Ratio (cash & equivalents, + receivables, + inventory) | Most speculative. A simple, quick, and easy snapshot of a company’s liquidity position. | Assumes all inventory can be sold within 90 days for book value. Investors should proceed with caution. |
| Quick Ratio (cash & equivalents, + receivables) | Moderately conservative. Good in most cases, generalizes well to most companies. | Penalizes firms with highly liquid inventory (like Walmart). Subject to receivables risk. |
| Cash Ratio (cash & equivalents) | Very conservative. A high cash ratio implies an airtight liquidity position | High false negative rate. Overlooks near-term receivables as well as any inventory. |
How to Improve a Negative Current Ratio
There are a few basic steps firms can take to improve their current ratio.
- Pay Off Current Liabilities: It is quite simple. The longer that liabilities stay on the balance sheet, the larger the number will be for current liabilities. If current liabilities have a higher number in the denominator when calculating the current ratio, then the current ratio will not be as high.
- Use Long-term Financing vs. Short-term: By decreasing short-term debt from the balance sheet, a company can improve its short-term liquidity, and make the current ratio higher.
- Selling Unproductive Long-Term Assets: By discarding long term assets that are unused or obsolete, and converting them to cash, companies can add to their cash and cash equivalents stockpile and grow their current assets.
- Minimizing Withdrawals: Businesses should limit how much cash that owners or partners can withdraw from the company. It can harm the current ratio without adding any value to the business.
Drawbacks to Liquidity Ratios
The current ratio is a simple snapshot of a firm’s liquidity, but it is not conservative enough to be a reliable evaluation of a company’s balance sheet. Other liquidity ratios, while different in theory, largely have the same drawbacks.
- Based on Past Data – No Way To Forecast: These liquidity ratios are all based on the balance sheet, which looks backwards on past data. How is one to evaluate a company’s future prospects through these ratios? Metrics such as the current ratio may not reflect the business’ current reality or future prospects.
- Ignores Macro-level Changes: Since liquidity ratios only take into account a company’s past numbers, they have no way of evaluating how sudden, sharp, and unforeseen economic conditions can distort a company’s asset prices and inventory values. How relevant would a company’s current ratio be if it reflects numbers collected before a pandemic?
- Does Not Evaluate Company Management: Liquidity ratios only evaluate financial data and do absolutely nothing when evaluating a company’s non-financial attributes – i.e. its quality of management. The quality of a company’s management is arguably just as important as its finances, and a current ratio does not tell the full story. If there is a low current ratio, it could either be a company run by an apathetic CEO, or a driven CEO trying to turn a company around. Just looking at the ratio does not tell the whole story.
- Accounting Practices + Manipulation = Inconsistent Numbers: Comparing the liquidity ratios between two companies in completely different sectors is pointless and misleading. However, even companies in the same sector could employ different accounting methods that would result in radically different ratios. A company’s numbers largely depend on their accounting practices. For example, a company that uses a LIFO accounting methodology will have different inventory valuations, and therefore current ratio, than a company that uses a FIFO accounting method. Companies also can easily manipulate these numbers in order to give themselves more attractive liquidity ratios.
[1]https://www.apple.com/newsroom/pdfs/Q3%20FY19%20Consolidated%20Financial%20Statements.pdf
[2] https://www.readyratios.com/