What is the Operating Margin?
The operating margin, also known as operating profit, operating profit margin, or return on sales, is a ratio which is used to measure how profitable a business is. The operating margin shows what percentage of revenue is left once a company accounts for costs of goods sold and operating expenses, but before interest and taxes – ie., a company’s EBIT.
Key Takeaways
- The operating margin measures a company’s profitability.
- The operating margin differs from the gross profit margin and net profit margin, and is somewhat of a middle ground between the two.
- Usually businesses want an operating margin of 15% or higher, but the sector and industry dictate much of what is considered a “good” operating margin.
Operating Margin Formula
Operating Margin is calculated using the following formula:
Operating Margin = Operating Income / Revenue
- Operating Income otherwise known as EBIT (Earnings Before Interest & Taxes), measures a company’s profits after deducting operating expenses, but before interest payments and taxes are accounted for.
- Operating Expenses sometimes referred to as selling, general, and administrative (SG&A)Expenses, refers to expenses that a business incurs to function on a day to day basis. In other words, expenses from normal business operations. Costs of goods sold are not considered operating expenses, nor are capital expenditures. Some examples of operating expenses could include the following:
- Advertising and marketing
- Maintenance and repairs
- Rent
- Research and Development
- Travel
- Utilities
- Revenue is often used interchangeably with “sales” and refers to the gross income received from normal business operations.
How to Calculate the Operating Margin from the Income Statement
Suppose we wanted to calculate the operating margin for Netflix (NFLX). This is Netflix’s consolidated income statement for the year ending December 31, 2019.
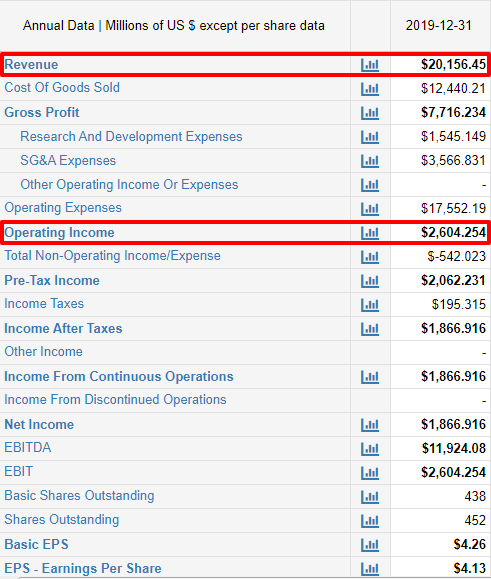
If we wanted to calculate the operating margin, all we would do is simply start from the top on the income statement. Notice how it starts with revenue. It then deducts Netflix’s cost of goods sold, then deducts its operating expenses. Netflix’s operating expenses include Marketing, Technology and Development, and General and Administrative. We then have our operating income. We simply take that operating income and divide it by revenue to get our operating margin.
For Netflix, their operating income for December 31, 2019 was $2.604B and their revenues were $20.156B. We simply take the operating income and divide it by the revenues to get the operating margin.
Netflix Operating Margin = $2.604B / $20.156B = 12.9%
The best way to evaluate a company’s operating margin, however, is to compare it to past operating margins. By analyzing multiple years, we can see how a company is trending, and if they should cut costs to improve their operating margin more. So, let’s take a look at the operating margin for Netflix over time:
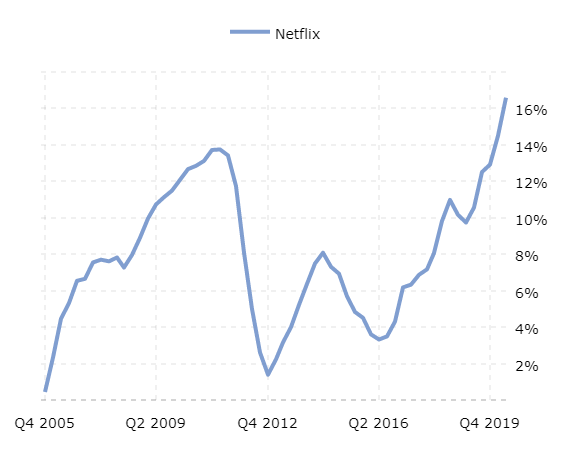
If we compare the operating margins from Q2 2016 through Q2 2020, we see that Netflix has truly done a great job with their operating margins. To grow from a margin of just over 3% in early 2016 to a margin of over 16% in 2020 shows a phenomenal growth in efficiency. It is extremely rare for a company to quintuple their operating margin in the span of four years. This shows that Netflix is a company that is growing robustly and is becoming more and more profitable over time.
What is a good Operating Margin?
Ideally companies want an operating margin of 15% or higher. 10% is considered average. A lot of evaluating a company’s operating margin depends on what sector the company is in, as well as macro trends to see if margins are going up or down. As seen with Netflix, the best way to evaluate a company’s operating profit, is to measure it over time, and see how it is trending. Companies want to see that their operating margin is growing, because it signifies that they are managing their operating expenses well and becoming more and more profitable.
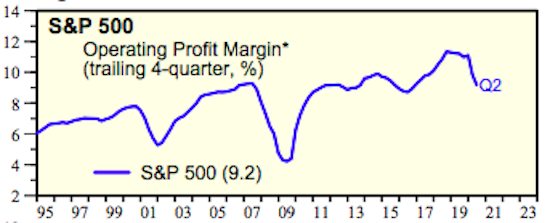
According to Yardeni Research, Inc.’s comprehensive report “S&P 500 Sectors & Industries Profit Margins”, as of September 2020, the average operating margin for the S&P 500 is 9.2%[2]. It also appears as if it is trending downwards somewhat, which is not good. The good thing though, is that it is a considerably higher margin than it was during the financial crisis of 2008.
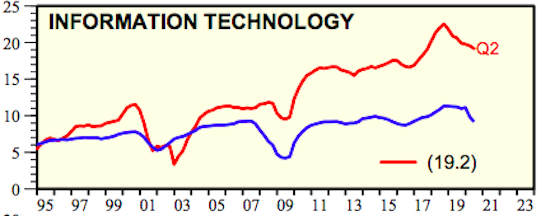
Tech appears to have the best operating margin right now, standing at 19.2%. This just makes Netflix’s current operating margin of 22% even more impressive, because it shows they are outperforming the industry. However, according to the charts, Tech’s operating margin has slightly dipped from its peak.
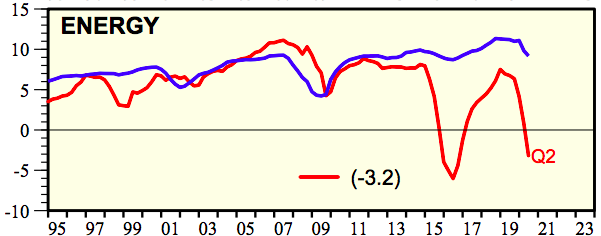
In terms of operating margin, the worst sector right now is Energy. As of September 2020, Energy has an operating margin of -3.2%, which is historically weak. It makes sense however, considering how battered that sector has been due to the COVID-19 pandemic. Oil demand, while somewhat recovering, hit an all-time low this year, even dipping to negative values per barrel – which literally means that oil companies had to pay people to take excess oil off their hands because demand was so low. Looking at charts paints a very grim picture for the Energy sector.
All of the following reasons might lead to some issues when interpreting the operating margin:
- Need to Evaluate Over Time: This is not a ratio that you can simply see and evaluate a company’s profitability. You need to see this ratio and compare it to past operating margins to truly see how the company is doing, and if they are improving their profitability.
- Does not Take Into Account Interest or Taxes: While the operating margin is a good simple way to evaluate how profitable a company is from their day to day operations, it does not show how profitable a company is from all phases of its business. Operating margin does not take into account two very important expenses – interest payments and taxes. It’s very possible a company can have a strong operating margin, but if their interest payments are through the roof, and tax expenses are cutting in significantly into their net profit margin, then it truly does not tell the entire story of how profitable the company is.
- Not an Indicator of Value or Cash Flow: Cash flow is the real lifeblood of a business, and the true driver of business value. Operating margin is simply an accounting metric, used to see how efficiently a company is utilizing its revenue vs. day to day expenses. Because the operating margin does not take into consideration non-cash expenses such as depreciation and amortization, stock-based compensation, capital expenditures, nor changes in working capital, it really is not telling the full story of a company’s value.
- Not Sufficient as a Standalone Ratio: For all the aforementioned reasons, the operating margin is not sufficient to evaluate a company as a standalone ratio. It needs to be compared with past years, it does not take into consideration interest or taxes, nor does it take cash flow, non-cash expenses, or CapEx into consideration. It is nice as a supplemental ratio to evaluate a specific aspect of a business, but it won’t do the job as a standalone ratio to evaluate the full story of a business.
Example 1: Netflix (NFLX) vs. Roku (ROKU)
To see how to evaluate the operating margin in practice, consider the operating margins of Netflix (NFLX) and Roku (ROKU). Both are high flying tech names, and direct competitors in the streaming space. Roku is an upstart, investing countless resources to desperately try to take some of Netflix’s market share. operating margin is a good quick way to compare two companies in a similar sector, because it shows who is managing their revenue vs. expenses more efficiently, and who is profiting more from their main operations.
It is also important to make sure to evaluate the operating margin from the past 3 years, minimum.
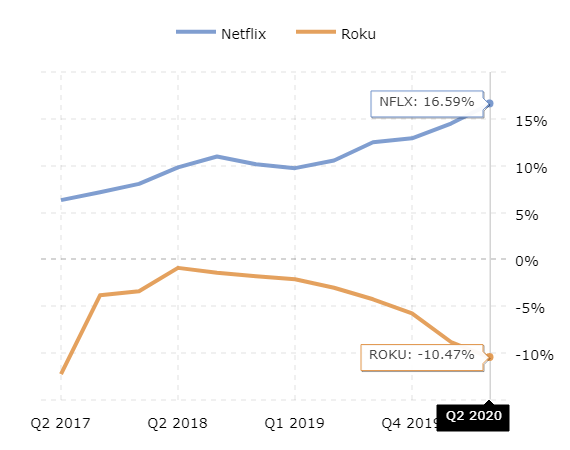
Source: Macrotrends
According to this chart, not only is Netflix’s operating margin significantly better than Roku’s, but it’s trending upwards while Roku’s is trending downwards. This shows that Netflix is doing a continuously better job at managing its operating profit vs. operating expenses and is managing its costs more efficiently.
Roku on the other hand, is doing the exact opposite- possibly because it’s sinking so much money into growing its business. But their trend line is not good and indicates a company that is not managing its operating profits efficiently.
Operating Margin vs. Gross Margin
The operating margin is not the only measure of a company’s profitability. Another key indicator is the gross margin, or gross profit margin.
Gross Margin is calculated using the following formula:
Gross Margin = Gross Profit / Revenue
While gross profit margin is a good way to dissect the relationship between a company’s revenue and COGS, and how efficiently a company is producing and selling its products, it tells even less of the story of a company’s profitability than the operating margin does.
Operating Margin vs. Net Profit Margin
When comparing the operating margin and net profit margin of a company, the net profit margin tells a completer and more comprehensive picture of how profitable a company really is. That is because it is considers all expenses, not limited to operating expenses. Most notably, it considers interest expenses and tax expenses.
It is also considered the most conclusive ratio for a business. Why? Because if there are major issues with other ratios or the company’s performance, the net profit margin will be adversely affected. It is a good idea to start the investigation or analysis by looking at this ratio.
The formula for the net profit margin ratio is as follows:
Net Profit Margin = Net Income / Revenue
To calculate net income, you simply take the operating income or EBIT, and deduct the interest expense, tax expense, and any other expense incurred.
In comparing Netflix’s operating margin with its net profit margin, we can see how much interest and taxes truly cut into EBIT, and tell a more comprehensive and conclusive picture of the state of a business.
According to this chart, the net profit margin of Netflix is nearly half of what the operating margin is. This is still decent, but it truly illustrates why operating margin is not a sufficiently comprehensive ratio to stand alone as the end all be all judgment of a business. If there is any ratio that could be considered a standalone ratio, it would be the net profit margin.
To summarize:
| Metric | Pros | Cons |
| Operating Margin (Revenue-COGS-Operating Expenses)/Revenue | Quick and easy snapshot to show how efficiently a company manages Operating Profit vs. Expenses Effectively shows how good a company is being managed, and its performance. | Does not take into account interest and taxes. Only good as a supplementary ratio and is not comprehensive enough to stand alone. Not sufficient enough to evaluate over 1 year…need to evaluate it over time to see where the company is trending. |
| Gross Margin (Revenue-COGS/Revenue) | Simplest ratio out of the 3 and gives a snapshot of how effectively the company is producing and selling products. Extremely easy and useful to forecast future revenues and COGS of company | The least comprehensive of the 3 profitability ratios. Does not effectively measure total profitability. |
| Net Profit Margin (Revenue-COGS-Operating Expenses-Other Expenses-Interest-Tax)/Revenue | Very conservative and comprehensive. Can better stand alone as a ratio to evaluate a company in totality. | Because it’s a conclusive ratio, if any ratio goes wrong, or if anything goes wrong with the company, this ratio will be affected. A low profit margin can be misleading on how well or poorly a company is operating. |
How to Improve a Poor Operating Margin
There are a few basic steps firms can take to improve their operating margin.
- Streamline Operations and Reduce Expenses: If firms can streamline or automate operations as much as possible, and reduce unnecessary day to day expenses, then this is a good first step in improving their operating margin.
- Raise Prices: Customers may not like this option very much, but if a company can cut costs while simultaneously raising prices, a company’s operating margin will naturally increase.
- Properly Scale Business: Make sure the business is growing proportionately to its revenues and expenses. In other words, make sure to properly evaluate the business, and determine how to properly invest more into the business, while revenues grow or outpace the growth in expenses. Companies like Netflix that can continuously grow revenue, while simultaneously growing their operating margin, are clear winners.
- “Trim Waste”: Make sure you are limiting operating expenses to only necessary activities vital to the daily operations of the business and trim all excess expenses to improve the margin.
Drawbacks to Profitability Ratios
Profitability Ratios are a good way to measure a company’s profitability and efficiency, however, unless the ratio is the net profit margin and a comprehensive and conclusive view of a company, profitability ratios simply do not take enough things into consideration, including cash flow, assets, and liabilities.
- Difficult to Compare Companies in Different Sectors: Profitability ratios can be quite different depending on the industry that the company is in. Netflix, for example, will have a much different operating margin than Chevron.
- Minor Errors Can Throw the Whole Ratio Off: These ratios, namely the net profit margin, are dependent on multiple calculations from each line on the income statement. If there is one single error or fraudulent calculation, the ratios will be wrong and mislead investors. This can cause serious problems for a company.
- Does Not Evaluate Company Management: Like all other ratios, only financial data is analyzed. Ratios do absolutely nothing when evaluating a company’s non-financial attributes – i.e. its quality of management. The quality of a company’s management is arguably just as important as its finances, and ratios do not tell the full story. While the operating margin does a good job at giving an overview on how well a company is being managed, it does nothing to tell investors about the quality of the people actually managing the company.
- Accounting Practices & Manipulation: Companies in the same sector can employ different accounting methods that can result in quite different and misleading numbers. A company’s numbers largely depend on their accounting practices. Companies can manipulate numbers on their income statement in order to increase or decrease the ratios depending on their needs, and intentionally mislead investors.