When companies report their “earnings,” they mean their net income. Net income is the profit retained once all costs incurred in a period have been subtracted from sales revenue.
Once net income is known, it becomes a matter of simple division to arrive at earnings per share, or EPS. From there, analysts apply multiples — based on the company’s specific industry, the direction of the economy and other factors — to determine what a fair value might be for the stock price.
While net income is literally the “bottom line” that each publicly traded company reports, it isn’t the only measure of its profit. Other measures add back expenses that might be less relevant to the health of a company’s ongoing operations.
Key takeaways
- Net income is the most widely used measure of a publicly traded company’s profitability.
- It differs from other profitability metrics in that it considers all expenses — cash and non-cash, operating and non-operating — to provide a bottom-line figure consistent with generally accepted accounting principles.
- It is an input to the formulas for net margin and earnings per share, each of which provides a point of comparison against a company’s peers.
- Other profitability metrics include operating income, EBIT and EBITDA, each of which has its own purpose.
The net income formula
The net income equation is deceptively simple:
Net Income = Revenue – All Expenses
“All Expenses,” though, is quite expansive. Let’s look at a typical income statement, and how the bottom line might not fully reflect economic reality. It might be instructive to consider a company playing in a heavy industry which was not effected too much by externalities. So let’s look at household appliance manufacturer Whirlpool:
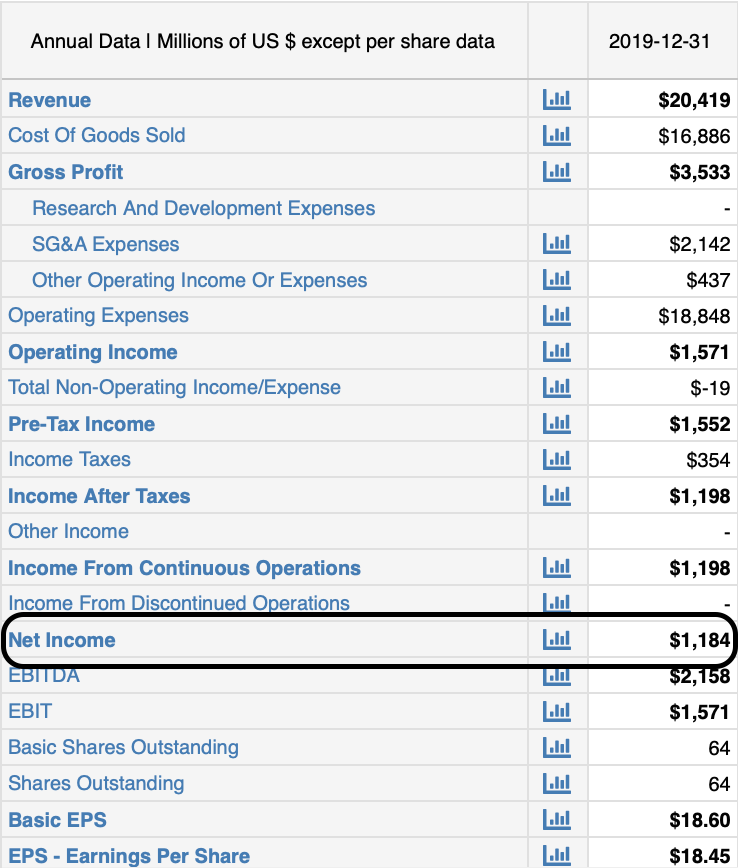
You’ll notice that there are some stops along the way from revenue to net income. The first is subtracting out cost of goods sold, or COGS, from revenue in order to arrive at gross profit. COGS is comprised of those expenses directly related to inventory — acquiring it, storing it, adding value to it and shipping it. A company involved in manufacturing or materials is likely to have higher COGS than a service or software company with the same revenue.
The next stop is operating income, which is gross income after other operating expenses aside from COGS have been taken out. Here we subtract two more acronyms: research and development, and selling, general and administrative — R&D and SG&A respectively. These are essentially the costs of improving the product and process, and the costs of running the corporate headquarters.
“Other Operating Income” — added at this point, just as “Other Operating Expense” would be subtracted — could be anything. In the case of Whirlpool, took a gain on the sale of its Embraco compressor business. That kind of information — as important as it is to getting at the economic truth of a company — doesn’t fit in tables that only have room for hard numbers. You can only find them in the footnotes of these tables or in management’s discussion of them. Same for To gain these insights, it’s important to go back to the primary source: the annual report. While most publicly traded companies issue a glossy annual report mainly for marketing purposes, the boiled-down, standardized version can be found in the Securities and Exchange Commission’s “EDGAR” database. For filing purposes, such an annual report is prepared as Form 10-K. Here’s a link to Whirlpool’s 2019 10-K, from which the above income statement was culled.
We’ll spend just a moment discussing non-operating income and expenses, because they’re zeroed out in this example. Essentially, they’re an income or expenses unconnected to a business’s core operations. These are typically gains or losses from foreign exchange or from hedging strategies used to stabilize the costs of commodity inputs. While such items are part of the regular course of business on a daily basis, this is also the line where companies report such one-off events as selling off a business unit or taking an accounting charge to recognize the cost of a corporate restructuring.
After adding in non-operating income and subtracting out non-operating expenses, the company arrives at its pre-tax income. As you’ve already intuited, the next step is to take out taxes on corporate income. That leaves you with income from continuing operations.
For many companies, income from continuing operations is essentially the same as net income — they’ve added up all their expenses and subtracted them from top-line revenue. Still, it is often the case with large, global companies that there’s one more step. If you see a difference between income from continuing operations and net income, you can usually attribute it to income or loss from non-controlling interests. In a nutshell, these non-controlling interests are smaller companies in which the larger one has only a minority share of the voting stock. These might be innovative startups which perform an R&D function for the parent company, or they might be foreign affiliates of the parent company in countries where laws require local ownership of the controlling interest.
Whatever the specifics, Whirlpool took a $14 million loss on its non-controlling interests in 2019, yielding a net income of $1.2 billion.
What is considered a good net income?
Because net income is a raw number rather than a ratio, there’s no such thing as a “good” or “bad” figure. One thing to pay attention to, though, is how much net income a company reports as a proportion of revenue. This yields the net margin, also called the profit margin, which is calculated as:
Net Margin = Net Income / Total Revenue
which assesses operational profitability and efficiency. It’s used to explain, in one percentage figure, how much money a company keeps compared to how much money it took in from sales. In the current case, Whirlpool’s 2019 net income of $1.2 billion is 5.8% of its $20.4 billion in revenue. That suggests that, out of every dollar Chevron took in that year, it made almost six cents. While this might sound like a pittance, it’s really not bad.
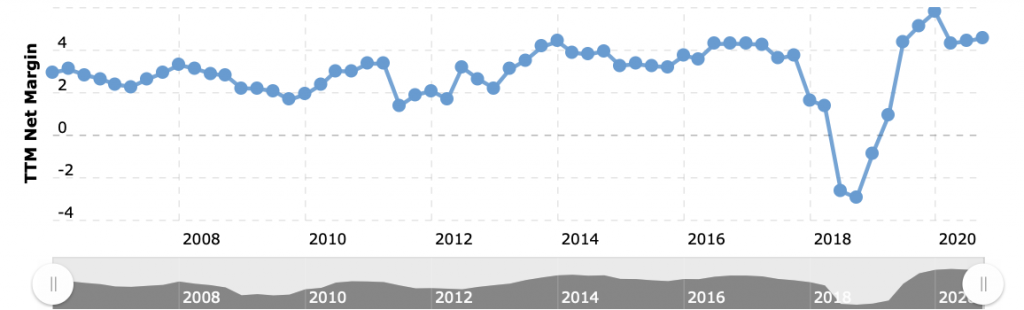
It’s slightly higher than than Whirlpool has posted historically, and much better than the profitability swoon it apparently experienced in 2018.
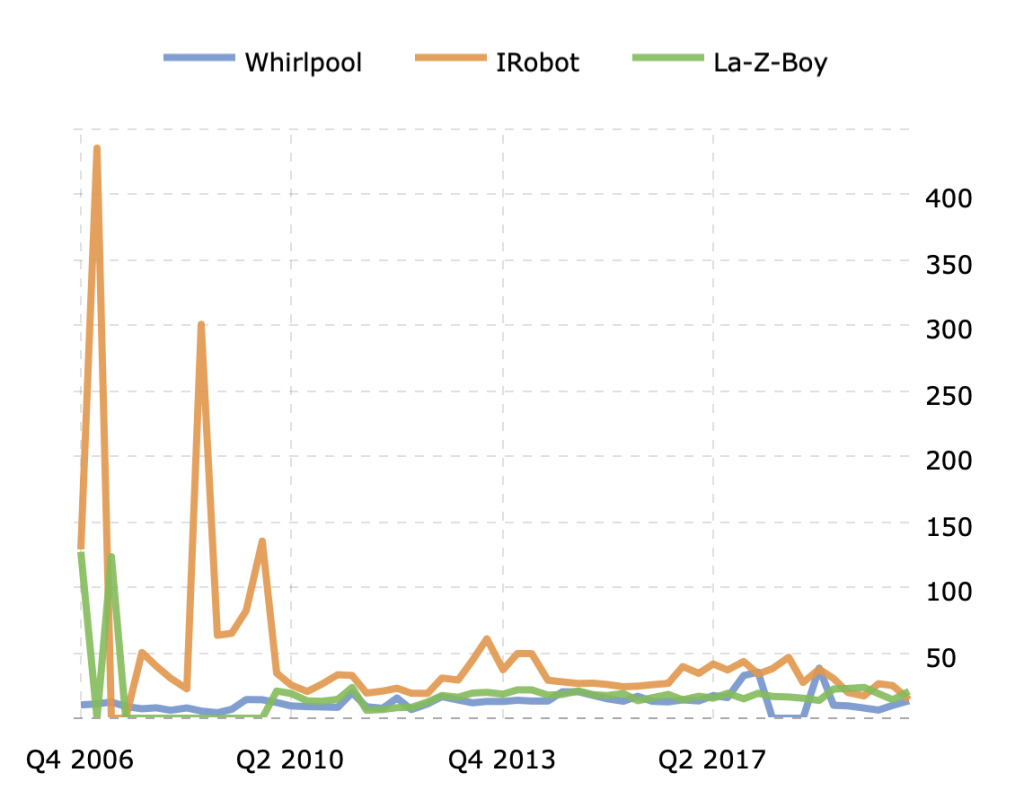
What might be instructive, though would be to compare Whirlpool with its peers iRobot and La-Z-Boy:
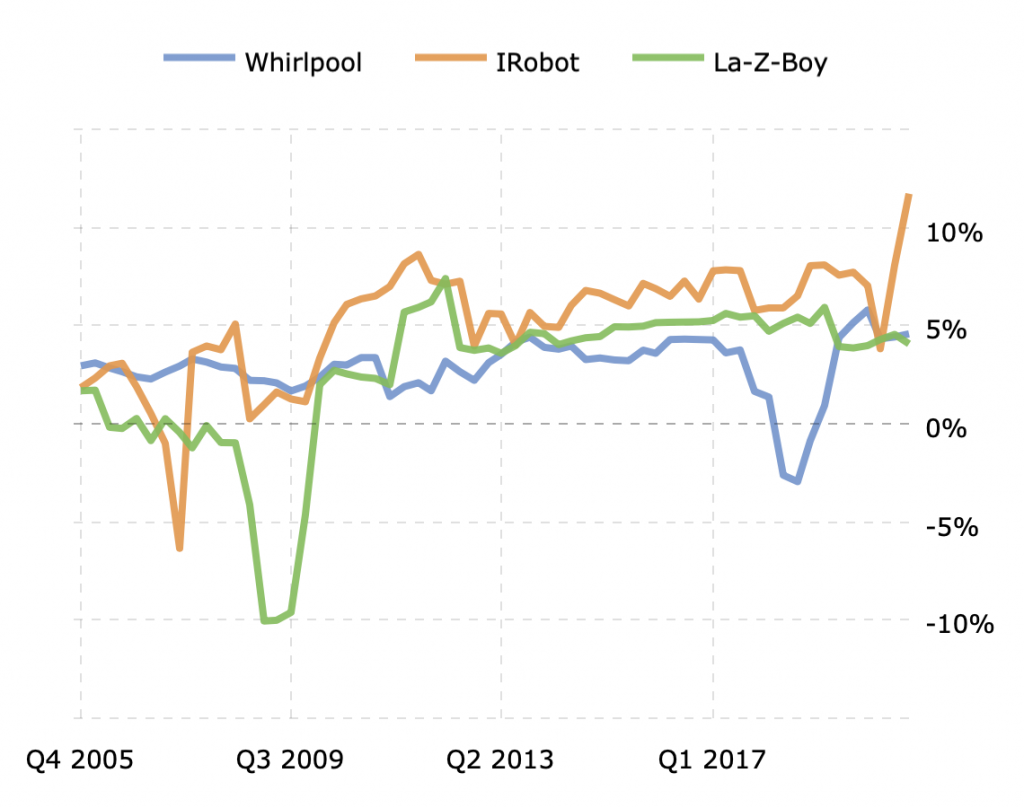
From this chart, we can see that Whirlpool was able to maintain its margins during the Great Recession while those of other appliance makers took sharp losses. Since then, iRobot has generally led the field in terms of net profit margin, while Whirlpool and La-Z-Boy have been making money slow and steady. The exception for Whirlpool was in 2018, when it lost a major retail channel as its agreement with Sears came to an end.

According to FactSet, the five-year average net margin for the S&P 500 is 10.6%. That figure, though, appears to be beyond the capacity of companies that are in an industry this mature.
Net Income and Valuation
Net income is of particular interest to the investor community because it informs a key valuation metric, the Price-to-Earnings ratio, or P/E, which is computed:
P/E = Share Price / EPS
where Earnings Per Share (EPS) is computed:
EPS = Net Income / Quantity of Outstanding Shares
In Chevron’s case EPS would be reckoned as $1.2 billion in net income divided by 64 million shares, or $18.45 per share.
Once the EPS, is known, the next step is to determine the market price. This doesn’t come from the income statement, but it’s easily culled from any of a number of financial news websites. These include CNBC, CNN Business and Yahoo! Finance, all of which are accessible without a paid subscription. Let’s take a look at what Whirlpool’s price on the date this article was written:
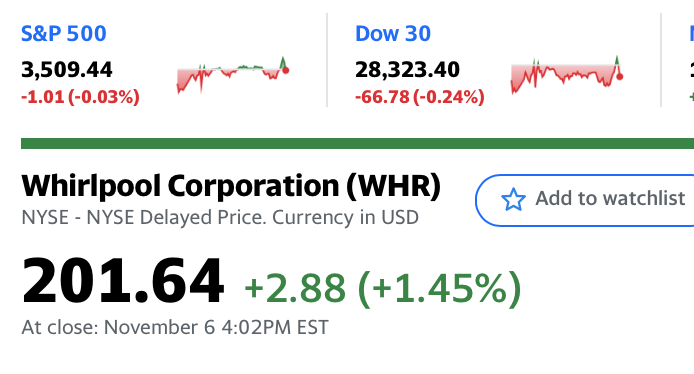
So, given a share price of $201.64 and EPS of $18.45, we compute a P/E of 10.9. This indicates that investors are willing to pay 10.9 times more than what Whirlpool is earning per share in a year. With that known, the next step is to compare it with its peers:
As with any mature industry, Household Appliances tends to chug along through good times and bad. When autonomous vacuum cleaners were still a new thing, iRobot was able to attract higher ratios. For the past decade, though, it has been on a par with stalwarts Whirlpool and La-Z-Boy. And again, we see evidence of Whirlpool’s short-term pain from its loss of shelf space at Sears but, as of this writing, all three companies’ P/Es have essentially converged.
Net Income vs Other Profitability Metrics
Net income isn’t always the best measure of profitability. It includes such costs as interest and taxes, over which a company’s management has little control. It also includes depreciation and amortization expenses, which are accounting charges that don’t reflect a current outlay of cash. Other profitability metrics address these issues.
On our way to calculating net income, we first had to calculate operating income, which is also helpful in viewing a company’s profit. Operating income is – as the term itself implies – a measurement of a company’s success stemming from its core operations only. To review, Whirlpool’s 2019 operating income was $1.6 billion, calculated as:
Operating Income = Gross Income – Operating Expenses
where
Gross Income = Revenue – Cost of Goods Sold (COGS)
and Operating Expenses are all other cash expenses, except COGS, that are directly related to the core business.
Operating income, then, measures how efficiently a business spends its budget on items directly related to creating and selling its products and services. It is approximately equal – though not necessarily identical to — Earnings Before Interest and Tax (EBIT), which is calculated:
EBIT = Net Income + Interest Expense + Tax Expense
Like operating income, EBIT is used in the analysis of a company’s core operations without the impact costs attributable to capital structure or tax jurisdiction. In Whirlpool’s case EBIT does indeed equal operating income.
While income taxes of $354 million are broken out on Chevron’s income statement, interest expense is not, but we can impute it from what we know. Total EBIT is reported as $1.571 billion. If we subtract net income of $1.184 billion, that gets us down to $387 million. If we then subtract taxes of $354 million, what remains is $33 million of interest expense.
EBIT is related to another profitability measure, Earnings Before Interest, Tax, Depreciation and Amortization, or EBITDA, calculated as:
EBITDA = Net Income + Interest + Taxes + Depreciation + Amortization
EBITDA requires adding back non-cash items found on the company’s cash flow statement:
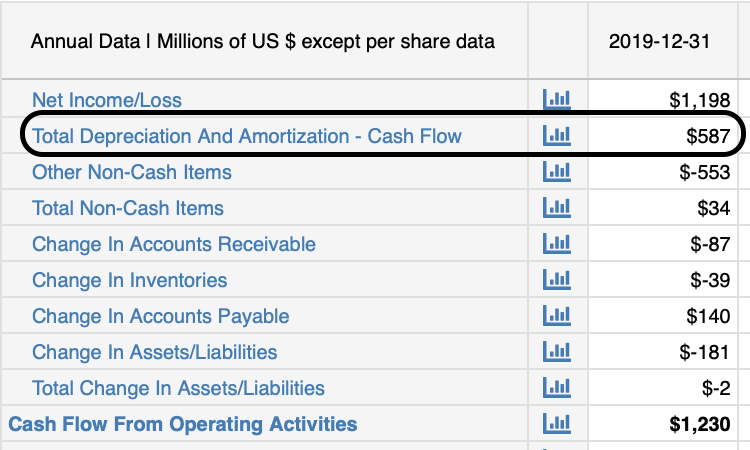
Adding that $587 million in depreciation and amortization to Whirlpool’s EBIT figure, and we arrive at a 2019 EBITDA of $2.2 billion.
You may have noticed that the net income, operating income/EBIT and EBITDA — $1.184 billion, $1.571 billion and $2.158 billion respectively — are actually fairly close. But they need not be. If we were to take an example from a cyclical industry with high fixed costs — Oil and Gas for instance — they might not even be in the same ballpark. And yet each of these measures of profitability is valid, depending on the purpose with which it is being considered.
Net income is the profitability measure that adheres to generally accepted accounting principles. This is the figure that is submitted to tax and regulatory authorities.
Operating income considers only those expenses that are directly related to ongoing operations, and nets out those that might be isolated occurrences stemming from the firm’s financing or investing activities.
EBIT filters out interest expense, which can warp the results because it’s money going to debtholders who, as valuation consultancy Stout notes, are also investors. Taxes comprise an expense that, at least in most investors’ time horizons, the company’s management has no control over.
Meanwhile, EBITDA takes the EBIT approach and makes one more allowance. Depreciation and amortization are essentially accounting functions that have absolutely no bearing on how much cash is flowing into or out of the business, so it has little bearing on a company’s forward-looking prospects.
| Metric | Pros | Cons |
|---|---|---|
| Net Income (EBIT-Other Non Operating Expenses-Interest Expense-Tax Expense) | ● The most comprehensive look at a company’s profitability because it accounts for all operating expenses, non-operating expenses, interest expenses, and tax expenses. ● The best way to find how much value a company is truly creating after all their expenses are accounted for. | ● Does not tell investors about a company’s operating income or profit or operating cash flows. ● Only based on past data and assumptions, and does not explain a company’s growth prospects or forecasted cash flows. |
| Operating Income (Gross Profit – Other Operating Expenses) | ● Focuses on those expenses with the greatest bearing on a company’s future earnings. ● Doesn’t include taxes and other one-off items that may skew a company’s results. | ● Doesn’t include non-operating income non-expenses. ● Doesn’t include other income. |
| EBIT (Revenue-COGS-Operating Expenses) | ● Offers a more comprehensive view of a company’s operating income because it includes depreciation and amortization. ● A more truthful look at what a company’s operating income really is than EBITDA. | ● Cannot be considered truly comprehensive, because it ignores a company’s taxes and interest payments. ● Can be used by companies to mislead and cover up financial failures, shortcoming, and levels of debt, because it does not account for interest and taxes |
| EBITDA (EBIT + Depreciation + Amortization) | ● Shows the value of a company’s cash flow and overall profitability from operations. ● Good way to compare similar companies as a % of total revenue, because it ignores depreciation, amortization, debt, and capital expenditures. | ● EBITDA is a misleading measure of liquidity and does not reflect the true value of a company’s liquidity or actual income. ● EBITDA ignores the change in working capital and may overstate cash flow in periods of working capital growth. |