What is the Quick Ratio?
The quick ratio is a metric which measures a firm’s ability to pay its current debts without selling additional inventory or raising additional capital. It is calculated as the dollar value of a firm’s “quick” assets (cash equivalents, securities, and receivables), divided by the firm’s current debt. The quick ratio is often compared to the cash ratio and the current ratio, which include different assets and liabilities.
Because the quick ratio is meant to give investors an instant assessment of a firm’s liquidity position, it is also known as the acid-test ratio.
Key Takeaways
- The quick ratio measures a company’s ability to pay its current debts without making additional sales or taking on additional debt.
- The quick ratio is more conservative than the current ratio (which includes a firm’s unsold inventory), but less so than the cash ratio (which excludes any near-term receivables.)
- Generally, a higher ratio indicates a healthier financial position. However, it can mislead if current assets are dominated by future receivables (i.e., a key customer might default, or debts might mature faster than receipts come in.)
Quick Ratio Formula
The general formula for the quick ratio is given as:
Quick Ratio = (Cash and Cash Equivalents + Marketable Securities + Accounts Receivable) / Current Liabilities
It can also be expressed as:
Quick Ratio = (Current Assets – Inventory – Prepaid Expenses) / Current Liabilities
Before proceeding, it’s worth noting that many of these terms have precise financial meanings, which might differ from their common sense usage:
- Cash Equivalents are either cash itself, or investments that mature into cash in at most 90 days. Examples include short-term Treasury bills, commercial paper (short-term unsecured debt issued by large, creditworthy firms) and money market funds.
- Marketable Securities is a category which often overlaps with cash equivalents. Examples can include exchange-traded equity positions, or debt securities with strong secondary markets.
- Current Liabilities are obligations which mature either within a given fiscal year or the normal operating cycle of the firm, whichever is longer. (A company’s operating cycle is the time required to produce a product, sell it, and collect receivables from customers.) For most businesses this includes accounts payable (i.e., short-term expenses to creditors, vendors, and suppliers), taxes, payroll (i.e., salaries, bonuses, commissions, etc.) and loans.
- Likewise, current assets are assets which are usually sold within that period. They include cash equivalents, marketable securities, and incoming receivables, but also extend to things like unsold inventory, and prepaid portions of future expenses.
How to Calculate the Quick Ratio from a Balance Sheet
Suppose we wanted to calculate the quick ratio for Apple (AAPL), whose balance sheet is shown here. (All data is in millions.) source
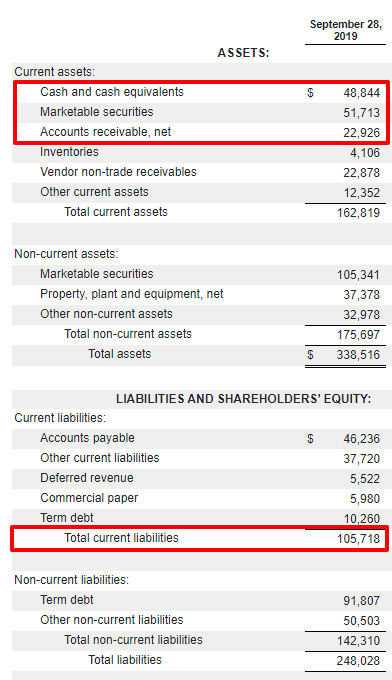
The easiest formula to use would be the first one (i.e., add up cash and equivalents, marketable securities, and net receivables.) We can entirely disregard non-current assets (things like goodwill, long-term receivables, and equipment) since these aren’t liquid enough to be counted.
For Apple, the quick ratio can be computed as follows:
Quick Ratio = ($48.844B + $51.713B + $22.926B)/$105.718B = 1.17
A ratio of 1.17 suggests that Apple has liquid assets worth about 17% more than its current debts. Having $1.17 of liquid assets for every $1.00 of current debt puts Apple in a healthy liquidity position.
What is a Good Quick Ratio?
A quick ratio of 1.0 suggests that a company is adequately liquid, whereas under 1.0 indicates the company may have trouble paying its impending debts. Over 1.0, on the other hand, is a signal of financial health.
Savvy investors should realize that there is considerable variation between industries in their business and financial norms (source).
- In 2019, sectors with the highest quick ratios include fishing (1.95), chemicals and allied products (2.12), and livestock (1.91).
- Likewise, sectors with the lowest quick ratios among listed companies include social services (0.29), restaurants (0.37), and general merchandise stores (0.16).
All of the following reasons might lead to sector heterogeneity with the quick ratio:
- Liquid inventory. If a firm’s assets lie largely in inventory, and that inventory consists of common household goods and staple foods (e.g., for a supermarket business), then excluding it from liquidity calculations could give an unjustly negative picture of a firm’s financial health.
- Risky receivables, such as in subprime financial services, could lead to an unduly positive quick ratio. This is because the quick ratio takes receivables at par, or without discounting for the risk of defaults.
- Securities risk is another potential avenue of risk. If a firm’s assets lie largely in marketable securities (e.g., in exchange-traded stocks), an economic event might cause the value of those investments to plummet over the 90-day window.
One thing to keep in mind when comparing quick ratios, is that companies across different sectors will have different standards for their quick ratios. For example, the quick ratio for a company like Apple, with little inventory, will be far different than a quick ratio for a company like Walmart, which always has a vast amount of inventory on hand as part of their business model.
Quick Ratio Example: Apple vs. Walmart
To see this in practice, consider the quick ratios of Apple (AAPL) and Walmart (WMT.) Walmart is an extremely inventory-heavy business with highly liquid stock. This means that Walmart can sell its inventory in the near term, for close to book value.
Looking at the chart below, it’s clear that the quick ratio formula penalizes such companies. Although Walmart’s current ratio, including inventories, is in the 0.8-0.9 range, its quick ratio is 40 to 50 points lower.
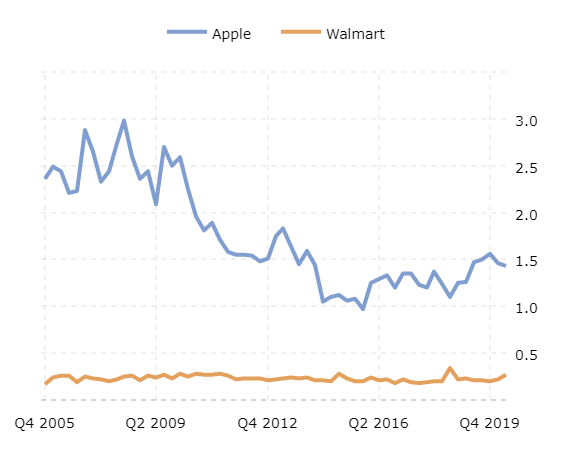
In addition, a company like Apple that has been extremely successful in building up its cash positions and current assets will have an increasing quick ratio over time. Apple’s strong revenue growth and high margins have clearly enabled an extremely strong liquidity moat.
It is important to note that the quick ratio is only one measure of a company’s financial health. Things like opening a new plant or ordering a large batch of materials (which indicate strong expected demand) are going to register as liabilities first. The profits from business expansion only appear as balance sheet assets many years down the line.
All these risk points state essentially the same fact. When assessing the financial health of a corporation, no ratio – quick or otherwise – can perfectly replace a detailed look into the data.
Quick Ratio vs. Current Ratio
As mentioned earlier, the quick ratio is not the only measure of a firm’s liquidity. Another key indicator is the current ratio, which includes quick assets, as well as inventory and prepaid expenses.
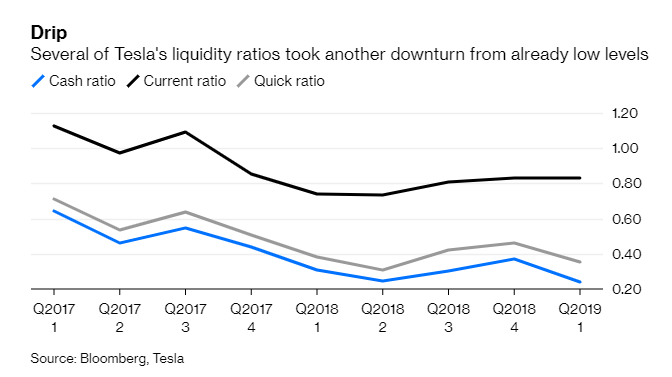
The current ratio often paints a more desirable picture of a firm’s balances. For example, the current ratio for Tesla above is 0.83, which is around 50% higher than its quick ratio. However, most professionals take a current ratio with a grain of salt, as they “recognize that stock (inventory) is not always converted into cash at full value.”[source]
Put another way, Tesla’s current ratio implies that it has $0.83 in cash, or assets convertible to cash, to meet its current debts. But if it had to rapidly mobilize its inventory, it might find them selling for less than book value (i.e., if it had to unload a stock of Model 3s with an old design flaw, or flood the markets with a surplus of metal scrap.)
Also, especially for larger firms, inventory is inherently difficult to measure (it might lie in warehouses all over the world or rely on quality/quantity judgments by human employees.) Hence, the current ratio might include greater measurement error (i.e., less precision) than the quick ratio.
Likewise, the $0.83 figure above requires that Tesla can take its prepaid expenses and turn them into cash to meet current debts. But if they’ve paid for half of their lithium needs for the quarter, they can’t turnaround those prepaid expenses into cash, and use them to pay other bills.
So prepaid expenses, although a balance-sheet asset, are misleading for liquidity.
To use the real-world example, the chart of Tesla (TSLA) data above gives a sense of the normal disparity between quick and current ratios. It is not uncommon for current ratios to be double, triple, or even 5X the quick ratio, depending on how inventory-heavy the business is.
Quick Ratio vs. Cash Ratio
On the other hand, the quick ratio is more inflated than the cash ratio, which excludes accounts receivables from a company’s liquid assets. The cash ratio for Tesla, for example, is only 0.58 – which means that, were the firm’s debts to come due tomorrow, instead of in the 90 days allowed for the quick ratio, the company would be insolvent (without additional financing.)
This example touches on the subject of the next section, and the main caveat to using the quick ratio in practice. Accounts receivable are an inherently risky asset. They are future payments customers owe, for goods which they’ve already received. But sometimes customers don’t pay their bills (i.e., they default), and recovering debts from bankrupt or fraudulent businesses can be a costly, drawn-out process.
Liquidity Ratios: Cash vs. Quick vs. Current
| Metric | Pros | Cons |
| Cash Ratio (cash & equivalents) | Very conservative. A high cash ratio implies an airtight liquidity position | High false negative rate. Overlooks near-term receivables as well as any inventory. |
| Quick Ratio (cash & equivalents, + receivables) | Moderately conservative. Good in most cases, generalizes well to most companies. | Penalizes firms with highly liquid inventory (like Walmart). Subject to receivables risk. |
| Current Ratio (cash & equivalents, + receivables, + inventory) | Most speculative. Investors should proceed with caution. | Assumes all inventory can be sold within 90 days for book value. |
Quick Ratio and Receivables Timing
Perhaps the most significant source of risk with the quick ratio lies in the accounts receivables category. As mentioned above, nonpayment is always a risk with future income streams.
However, that risk is vastly mitigated for a company whose credit terms to its customers are less favorable than those it receives from its suppliers. I.e., customers are required to pay invoices in 30 days, but the firm has 90 days to pay its suppliers. For such firms, the quick ratio is fairly accurate, as it’s unlikely that bills will come due that depend on future receipts.
In other words, the key lies in the timing. Even if a company’s assets are dominated by receipts, if they come in at a uniform rate that is faster than the speed at which bills come due, the company’s financials are probably sound.
How to Improve a Negative Quick Ratio
There are a few basic steps firms can take to improve their quick ratio.
- Improving Inventory Turnover: Faster inventory turnover means that, at any point in time, there is less inventory – which isn’t included in the quick ratio – and more cash or cash equivalents – which is.
- Improving Invoice Collection: Bringing long-term loans to customers into the 90-day period. For example, offering discounts or other inducements to pay early is one strategy. Firms might also grandfather in existing clients, while tightening terms of credit for new ones.
- Discarding Unproductive Assets. Most organizations have at least some assets which are obsolete, idled, or otherwise unproductive. By either renting out or simply selling these, firms can add to the cash equivalents category.
- Minimizing Drawings. Depending on corporate structure, businesses might permit business owners or partners to withdraw cash from the company. This should be kept to an absolute minimum, as it depresses the quick ratio without adding any value to the business.
- Paying Liabilities Early. Keeping payable liabilities on the books means maintaining a needlessly high denominator in the quick ratio formula.
Drawbacks to Liquidity Ratios
Although the quick ratio is a reliable snapshot of a firm’s financial health, it is ultimately a single statistic attempting to summarize an entire balance sheet. As such, it incurs the same drawbacks which affect all liquidity ratios. [source]
- Based on Book Value: Because the quick ratio is calculated based on balance sheets, which are backward-looking, they may not reflect the current reality of the business. Sharp changes in economic conditions (such as the COVID-19 pandemic) could easily distort asset prices and inventory values, making historical figures irrelevant.
- No Measure of Management Quality: The quick ratio is a function of financial data, and as such it is uninformative about management. A low quick ratio, for example, could equally be a sign of a blasé and apathetic CEO, or a bright and motivated executive trying to turn around a struggling company.
- No Cause of Changes Information: As a summary statistic, the quick ratio is completely uninformative about the driving forces behind changes. A drop in accounts receivable, for example, could be due to new and untrained employees, excessively lax credit policies, or simply customers flocking to the competition.
- Depends on Accounting Methodology: Although these ratios try to be a fair comparison for any two companies, it depends on each firm’s accounting practices. Firms that employ a “last-in, first-out” methodology, for example, will have different inventory valuations, and therefore current ratios, than firms which impute inventory based on “first-in, first-out.” Likewise, companies that fiddle with their definitions of timeframes like the operating cycle may be able to manipulate their quick ratios.
Sources
[1] https://investor.apple.com/sec-filings/sec-filings-details/default.aspx?FilingId=13709514
[2] https://www.readyratios.com/sec/ratio/quick-ratio/
[3] http://mercury.webster.edu/westedou/financial_ratios.htm
[4] https://smallbusiness.chron.com/problems-associated-using-financial-ratios-3979.html